


The [musical] tones of a well-managed age are at rest and happy: its government is balanced. The tones of an age of turmoil are bitter and full of anger: its government is perverse. The tones of a ruined kingdom are filled with lament and brooding: its people are in difficulty (68).
—“Record of Music,” ca. 2nd century BCE (Han Dynasty China), translated by Stephen Owen
Misty cold waters encircle the moonlit sands;
In night’s shadows my boat silently stands.
Across the river in the taverns,
Sing-song girls never mind the ruined kingdom’s sorrow,
Echoing “Flowers of the Courtyard” without a care for tomorrow.—Chinese classical poem by Du Mu (803–852 CE), translated by the author
1. Introduction
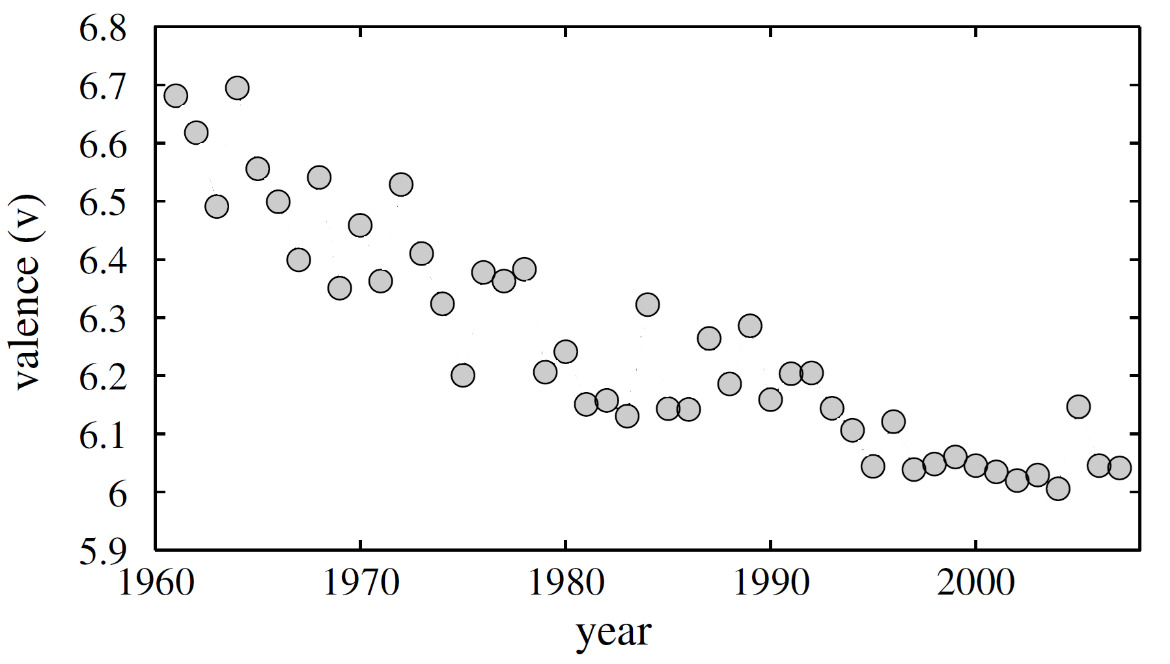
Past quantitative studies of popular music have measured the sentiment trends in large volumes of lyrics spanning multiple decades, using computer-assisted techniques of natural language processing (NLP) and linguistic, sentiment, and statistical analysis. For instance, Dodds and Danforth performed sentiment analysis over the lyrics of 232,574 English-language songs from 1960 to 2007 and detected a general, monotone trend toward more negative emotions that gradually leveled off (Figure 1). They interpreted this trend as a partial “reflection” of society’s deteriorating “emotional state.” DeWall et al. found similar trends among popular English-language lyrics from 1980 to 2007 and argued that those “mirror psychological change” moving toward individualism and the accompanying decline of mental health in the population (see also Napier and Shamir). Parada-Cabaleiro et al. confirmed this negative trend and remarked that lyrics “provide a reflection of a society’s shifting norms, emotions, and values over time” (1). Brand et al. also commented that pop songs “offer a window into [listeners’] emotional states and psychological preferences” and that “[c]hanging trends in pop music over time may therefore offer a means of measuring large-scale societal changes” (1). In the non-English context, Jo and Kim identified an opposite trend toward more positive emotional content in K-pop songs between 1990 and 2019, arguing that pop music, as a mass cultural product, “mirrors” the temporal shift in the collective “psyche” and proposing that text mining lyrics can track affect at the societal level, supplementing methods like surveys and laboratory experiments.
These studies largely share the same assumption that pop song lyrics reflect the representative sentiments of societies or the average emotional preference of listeners. However, this study asks the question: Is it possible that—as suggested by Du Mu’s nineth-century poem in the epigraph—there could be a general, sometimes even jarring, discrepancy between the average sentiment of lyrics and that of society or the average preference of listeners?
This alternative assumption gains traction once we, borrowing insights from economics and sociology, regard lyricists as producers operating under information constraints and listeners as consumers whose preferences are revealed only through consumption, both interacting in a messy, noisy cultural market. Producers rarely possess perfect knowledge of the “ideal” sentiment that will resonate with the majority but instead must infer it via market signals over time (Hayek). Moreover, lyricists, like all real decision-makers, “satisfice” rather than optimize (Simon), juggling narrative, rhetoric, rhyme, and rhythm, in addition to sentiment, while learning from audience reception. In practice, sentiment alignment emerges through a trial-and-error process: early compositions serve as experiments, with successful variants imitated and failures discarded in a market selection mechanism (Alchian; Nelson and Winter; Brand et al.). Because lyrics are experience goods, listeners often discover their own affective preferences only after exposure, prompting producers to update future work based on feedback loops (Nelson). Creative markets especially exhibit acute uncertainty—minor chance events or social influence can vault certain songs to prominence (Salganik et al.)—so that disequilibria are the norm rather than the exception (Caves). Consequently, the average sentiment of pop lyrics may routinely deviate from the average preference of listeners, even though the former, in the long run, is generally on a converging course equilibrating toward the latter, enacting an ongoing recalibration of production and consumption instead of simple mirroring.
Some scholars have raised similar questions. For example, from the adjacent field of literature, in studying the sentiment of over 300,000 Anglophone fictions published in the twentieth century, Morin and Acerbi question the mirror interpretation that literary sentiment trends reflect socioeconomic changes (e.g., Bentley, Acerbi, et al.) by proposing an alternative “regression-to-the-mean” explanation. They argue that the general decline in literary emotionality over the twentieth century could be just a lingering aftermath of the strong emotionality eruption caused by the Romantic movement in the previous century—it took over a century for emotions in fictions to “cool” down toward the historically “normal” level, thus, “regression to the mean” (9–11). In the terminology of system dynamics, “regression to the mean” is the process of literary sentiment equilibrating from some disequilibrium state (the Romantic shock) toward the equilibrium position (the mean). Such an equilibrating process is the result of the endogenous mechanism of the cultural market, independent of any exogenous societal change that might affect readers’ sentiment preferences; in fact, the mean (equilibrium position) is assumed to be largely stable (8). This is the equilibration interpretation this study aims to formalize.
1.1. Reflection vs. equilibration
Now with two plausible assumptions about the relation between lyric sentiment and listener preference, the abovementioned negative sentiment trend in English lyrics invites competing interpretations:
-
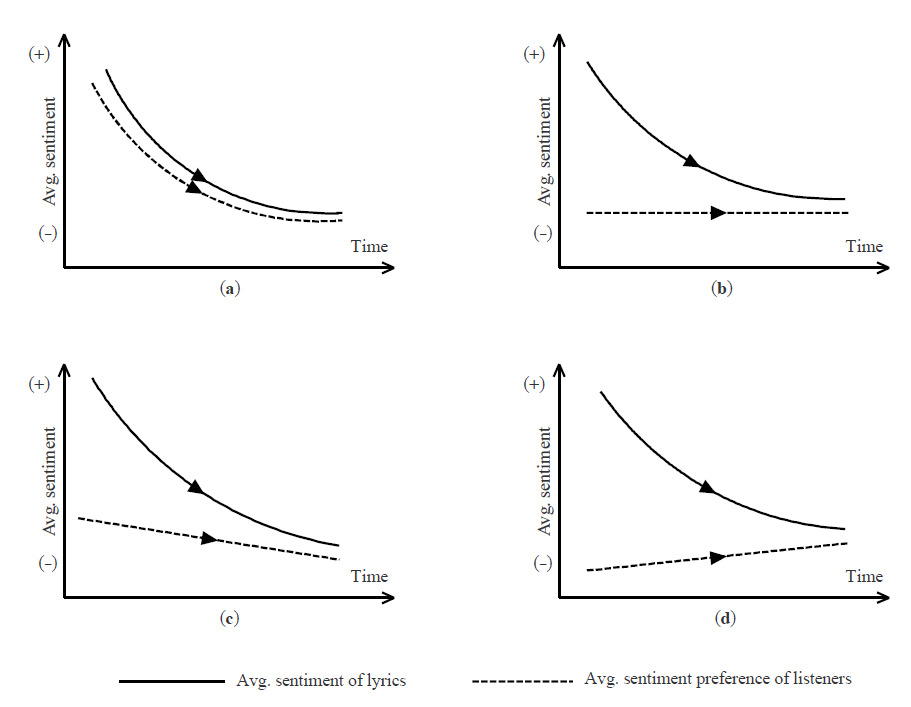
The mirror interpretation (Figure 2a) is that the downward lyric sentiment trend reflects a shift in listeners’ preferences toward more negative (or less positive) emotion in songs over time.
-
The equilibration interpretation (Figure 2b) is that the listeners’ average preference may hardly change at all; it is just that, early on, English lyrics, for whatever reason, were more positive than listeners’ average preference, and it took time for the “market” to bring lyric sentiment closer to the more negative (or less positive), yet largely stable, average listener preference—the equilibrium position.
-
The hybrid interpretation (Figures 2c and 2d) is a mix of the first two scenarios. It could be the case that lyrics’ sentiment was more positive than the average listener preference at first, and the average preference shifts slowly toward more negative emotion; it took some time for lyrics’ sentiment to catch up with the declining average listener preference (Figure 2c). Or, the average preference shifts upward slowly, and lyrics’ sentiment keeps dropping until meeting the former in the middle (Figure 2d), as the market force brings the latter closer to the former.
If the equilibration or hybrid interpretation is true, treating the observed trend of average lyric sentiment as a proxy for the unobservable trend of listeners’ average sentiment preference, or ethos of times, could be inaccurate or even misleading. For example, in the case of English lyrics (e.g., Dodds and Danforth), it is difficult to determine whether the trend toward more negative sentiment in lyrics should be mostly attributed to the decline in societal “emotional state” (Figure 2a) or to the equilibrating process toward the possibly more or less stable, average listener preference (Figure 2b or 2c). To complicate the matter further, declining emotional state might increase listeners’ preference for positive emotion in lyrics in that many depressed listeners may want more, not less, positive emotion in songs as compensation (Garrido); however, because the average lyric sentiment could be much more positive than the average preference early on, the equilibrating process of the market would still bring down the former to meet the rising latter in the middle, corresponding to the scenario in Figure 2d. Therefore, the same observed downward trend in lyric sentiment is logically compatible with all four possible underlying trends of listener preference that represent the three interpretations outlined above.

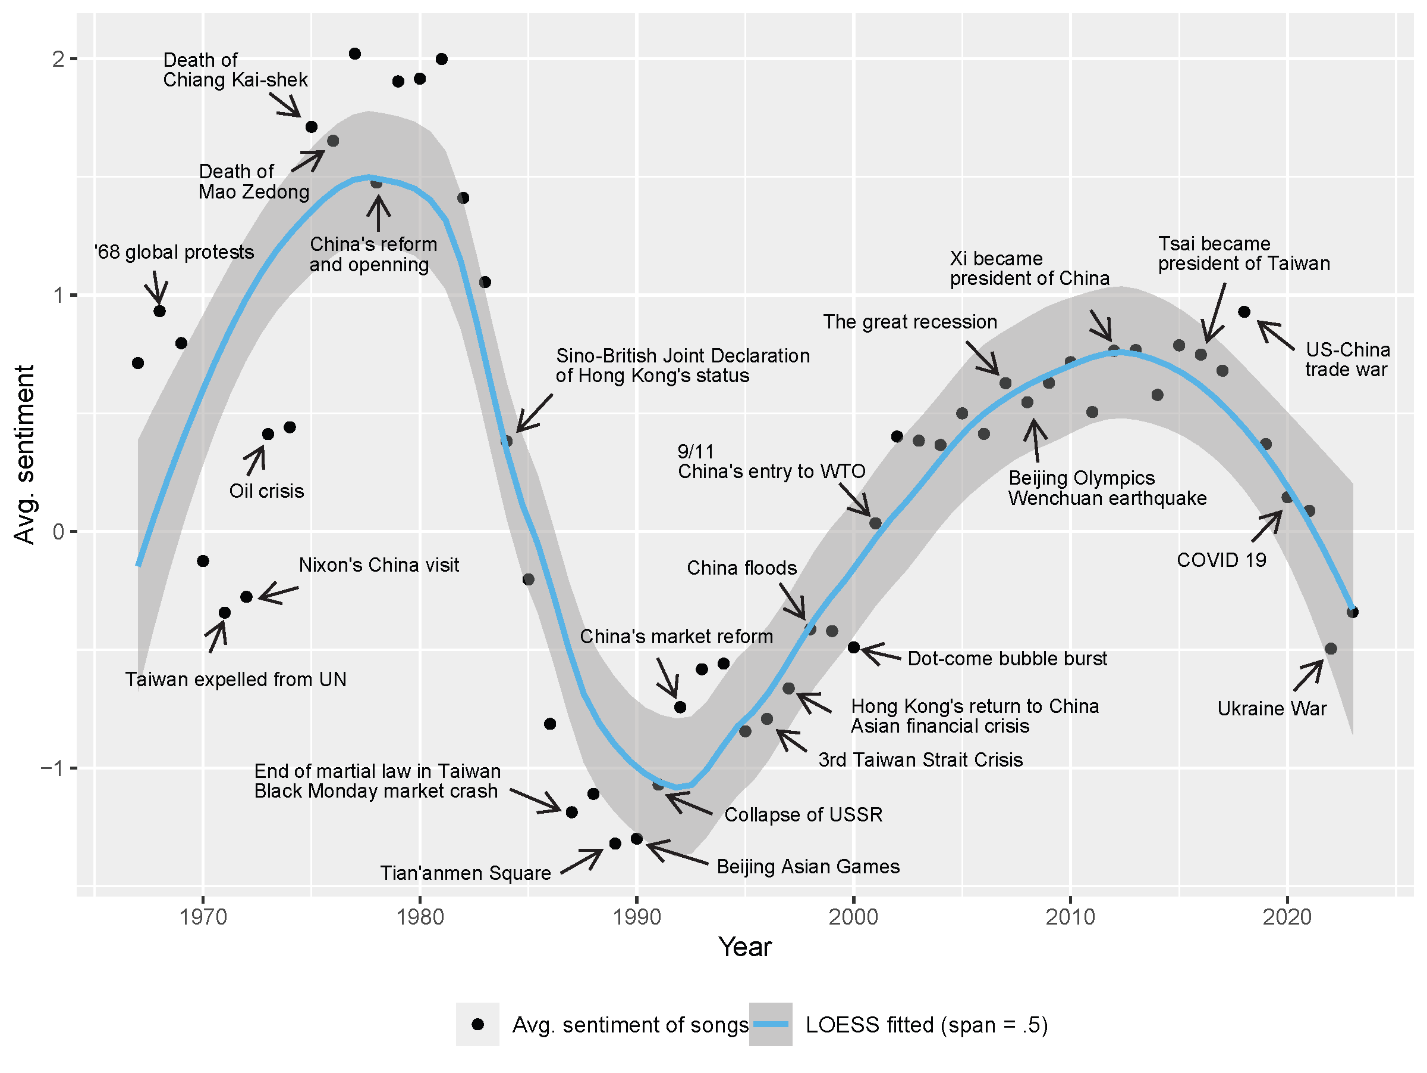
This study does not conclusively resolve the three interpretations, but as shown later, it lends support to the equilibration, or hybrid, interpretation with evidence from the case of Chinese-language lyrics. The sentiments are analyzed of more than 260,000 lyrics produced over six decades in the mass cultural market of Sinophone pop music. As elaborated later, the average sentiment in Sinophone lyrics exhibits a highly recognizable, damped, sine-wave-like pattern, with an estimated period of 34 to 35 years (Figure 3). This oscillating pattern can be most parsimoniously explained by the equilibration interpretation: the near-constant, average sentiment preference of listeners is the center of gravity, around and toward which the oscillating average lyric sentiment always equilibrates. As an analogy, just like the periodically swinging pendulum attests to the constancy, not variability, of gravity, the oscillating average lyric sentiment may evidence the stability, not volatility, of the average listener sentiment preference as the equilibrium position. This study does not stop at identifying sentiment patterns. It goes further to build a math model that explains the possible cultural process—interactions between music listeners and lyricists—underlying the formation of such patterns. It can be shown that the model can subsume both periodic patterns (in Chinese lyrics) and monotone trends (in English lyrics) as its two special cases. By offering a unified theoretical model that can explain both periodic and monotone empirical cases, this study suggests that the equilibration, or hybrid, interpretation is more plausible than, or at least as plausible as, the mirror interpretation.
1.2. Modeling cultural cycles
The periodicity of Sinophone lyric sentiment is unlikely to be driven by forces, cyclic or not, extraneous to the pop music market. Cycles are commonly modeled in social sciences, such as economic and business cycles, political cycles, and fashion cycles. There is a substantial literature on business cycles (Isaic et al.), but in contrast to the notoriously irregular business cycles (Chatterjee; Drautzburg), the detected lyric sentiment cycles take the highly recognizable form of the damped sine-wave shape. Moreover, the periods of common business cycles (Isaic et al.)—2 to 4 years of Kitchin’s inventory cycles, 7 to 12 years of Juglar’s investment cycles, 20 years of Kuznets’ infrastructure cycles, and 40 to 60 years of Kondratiev’s technological innovation cycles—do not match the 34 to 35 years of the lyric sentiment cycles. Additional quantitative analysis shows that the observed lyric sentiment cycles do not correlate with economic cycles (see Supplementary Materials 1). Thus, the former is unlikely to be driven by the latter.
While political cycles (Merrill et al.; Aguiar-Conraria et al.) are less random than business ones (but not nearly as sine-wave-like as the detected lyric sentiment cycles), they are partly regulated by an imposed election cycle in democracies, which is absent in the case of lyric sentiment cycles. Also, there had been no multi-party, democratic political system in Taiwan until 1996, let alone in China and Hong Kong. Political cycles are thus empirically irrelevant here, though they are theoretically relevant, as discussed later.
Furthermore, none of the major societal trends in the region under study, such as aging, divorce, mental health, and suicide, exhibits clear periodicity (Chang et al.; Fu et al.; Chen et al.). Finally, historic events have little consistent, long-term impact, if any, on the dominant trajectory (Figure 3; see also Supplementary Materials 1). Therefore, the lyric sentiment cycles are most likely a manifestation of some internal dynamics of the Sinophone pop music market.
Cultural cycles, such as fashion cycles, are perhaps the most relevant because the rise and fall of the average lyric sentiment may, to some extent, be seen as part of some fashion trend that follows its own dynamics. There are two broad approaches for modeling fashion cycles, one deductive and the other inductive. The deductive one is game-theoretical and agent-based modeling, which starts with assuming a set of decision and behavioral rules for a group or groups of agents (i.e., simulated individuals) and then derive patterned cultural outcomes (i.e., fashion) from aggregating the rule-based interactions among the agents, by way of either analytical solution or numeric simulation (e.g., Matsuyama; Pesendorfer; Acerbi et al.). A major shortcoming of this approach is that the complexity in model assumptions and the long chain of mathematical reasoning often impair operationalism, that is, “the ability to assess models” against “phenomena that occur in the real world in real time” (Coelho et al. 450). Therefore, although these deductive models can demonstrate the rationale for the general emergence and behaviors of cultural cycles under certain conditions, they are often inadequate in accurately explaining and predicting a specific empirical cyclic case, such as deriving and fitting the exact damped sine wave of lyric sentiment.[1] By contrast, the inductive approach is based on statistical modeling, which involves collecting time series fashion data and then fitting statistical models to the data (e.g., Lowe and Lowe; Belleau). While this approach could construct statistical models that fit well the cyclic data of a particular case, it is often hard to formalize the underlying theory and thus difficult to generalize, due to its ad hoc nature.
To overcome the shortcomings of both approaches, this study integrates them to ground deductive mathematical modeling in empirical data on the one hand and to enhance the theorizing and generalizing ability of inductive statistical modeling on the other. The modeling process starts with the observed data: for parametric modeling, just like a linear trend in a scatter plot entails linear regression, the damped sine-wave-like pattern of the average lyric sentiment (Figure 3) entails the Newtonian model of Damped Harmonic Oscillation (DHO) (Walker 430–32)—the oscillation that follows a sine or cosine wave with a damping amplitude (both features are present in Figure 3). This article first lays out the behavioral assumptions about the DHO model and constructs the model deductively. Then, the model is inductively calibrated, its parameters being statistically estimated using empirical data.
The rest of this article is organized as follows. Section 2 describes the data and methods used to measure the sentiment in Sinophone pop lyrics, followed by the obtained periodic results in section 3. The large language model (LLM) ChatGPT is first employed to extract the main emotions out of each lyric, based on which a sentiment score is calculated for that lyric using a lexicon-based approach.[2] Section 4 constructs a DHO model that explains the lyric sentiment cycles, including model assumptions, a kinetic model (modeling how relevant forces affect the movement of lyric sentiment), and nested kinematic models (derived from the kinetic model but modeling only the movement of lyric sentiment without considering the forces). Section 5 statistically performs model selection and parameter estimation using the lyric sentiment time series. Section 6 concludes with discussing the implications and limitations of this study.
The main contributions of this project are as follows. First, to the best of the author’s knowledge, this is the first large-scale, long-term quantitative study of the sentiment in Chinese-language pop song lyrics, and it is the first to combine LLMs and the lexicon-based approach to do so. Second, it identifies a highly recognizable, damped sine-wave pattern in lyric sentiment movement that has not been discussed elsewhere until now. Third, it builds a parsimonious math model that fits empirical data to a considerable extent. Fourth, the model’s explanatory power encompasses both periodic and non-periodic sentiment movements and, thus, challenge the common mirror interpretation with an alternative equilibration interpretation of the relation between lyric sentiment and listener preference. Fifth, this study complicates any attempt to use traits of mass cultural products as proxies for underlying socio-psychological trends. For readers in cultural analytics, the contribution here is both methodological and interpretive. Methodologically, the study offers a scalable pipeline—LLM-assisted extraction of salient emotions coupled with a lexicon mapping and aggregation—that can be ported to other large, time-indexed bodies of text for sentiment analysis. Substantively, the DHO reframing invites analysts to distinguish the movement of product features from the movement of audience preferences and to treat apparent trends in cultural data as possible outcomes of equilibrating market dynamics rather than direct mirror images of collective sentiment: an immediate implication for how cultural time series should be interpreted.
2. Data and measurement
The lyric data used in this study were scraped from mojim.com, one of the most comprehensive lyric websites that hosts a collection of nearly 300,000 pop song lyrics (as of mid-July 2023).[3] The collection contains lyrics produced in the highly integrated, transnational Sinophone pop music market, consisting of mainland China as the largest consumer market, with Taiwan and Hong Kong as the main producers, and secondarily Malaysia and Singapore (Moskowitz; Jones). While the website provides no genre classifiers, it does include songs from a wide range of popular forms, including rock, which is often positioned as the antithesis of the narrowly defined “pop music.” Therefore, this study uses the term “pop music” in its broadest sense as a “residual” category that subsumes various popular music forms, including rock, excluded from the other more institutionalized genres, such as classical music (Tsai et al.). The vast majority of lyrics in this collection were composed from the late 1960s and on, hence this study’s timeframe spanning from 1967 to mid-July 2023, when the lyrics were scraped from the website. After cleaning the data, 264,851 lyrics are left for analysis. Table 1 provides the distribution of songs across different singer types and regions. (For criteria for data cleaning and a discussion of data characteristics, see Supplementary Materials 2.)
Sentiment analysis has been employed to gauge emotions in text-heavy settings, such as customer reviews, social media posts, and literary works (e.g., Campregher Paiva and Diecke; Rebora; Wankhade et al.; Y. Liu; Zhang et al.). There are two broad approaches to sentiment analysis: machine-learning and lexicon-based approaches (Wankhade et al.). For machine learning, because it requires human-annotated textual contents to train the model, it cannot be economically deployed for a corpus of a different nature, where there are no human-annotated contents for model training as is the case with lyrics. As an effective alternative, the lexicon-based approach measures the overall sentiment of a text by, roughly speaking, first comparing each word or phrase in the text against the entries in an emotion lexicon, assigning a sentiment value from the matched lexicon entry to that unit of word(s), and then aggregating the sentiment values over all units into a sentiment score for the entire text.
However, there are two major limitations of the lexicon-based approach. First, because not one of the existing emotion lexicons is exhaustive, this approach might not capture all the emotions contained in the text, missing emotions in words not included in the lexicon. Second, just like the overall meaning of a text is not the same as the simple aggregation of the meaning of every word in the text, the overall sentiment differs from the simplistic summation of sentiments of all words. While it is relatively easy to improve the first drawback by expanding the lexicon through incorporating more synonyms (as is done in this study), the second limitation is much harder to overcome because it requires human-level cognition to abstract, synthesize, and discern expressive complexities such as sarcasm, irony, and figures of speech (B. Liu; Wankhade et al.; Campregher Paiva and Diecke).
To address those limitations, this study develops a novel method for sentiment analysis, combining LLM and the lexicon-based approach. LLMs like ChatGPT, with their near human-level comprehension, are best suited for extracting information out of a large quantity of relatively short texts, like lyrics, with high efficiency. Recent research has consistently shown that ChatGPT outperforms the best lexicon-based algorithms in sentiment analysis with an increase in accuracy as high as 20 to 25%, demonstrating significant potential in enhancing sentiment analysis (Belal et al.; Sudirjo et al.; Campregher Paiva and Diecke). The implementation of this new approach in this study consists of two steps. First, use Python to feed lyrics to ChatGPT 3.5-Turbo through OpenAI’s API (Application Programming Interface) and, for each song, ask ChatGPT to output three emotionally descriptive Chinese words—for example, beishang 悲伤 (sadness), jianding 坚定 (determination), xiwang 希望 (hope)—to name the major emotions in that lyric.[4] Second, find matches of the three output words among the entries in a Chinese emotion lexicon and, for each word i (i = 1, 2, 3), fetch two values from the matched entry: the word’s emotional valence vi (vi = 1 for positive emotion, −1 for negative emotion, and 0 if no matched entry) and intensity Ii (Ii = 1, 2, 3, 4, 5, with 1 denoting the lowest emotional intensity and 5 the highest). The overall sentiment score S for that song is calculated using Equation (1),[5]
S= 3∑i=1vi⋅Ii.
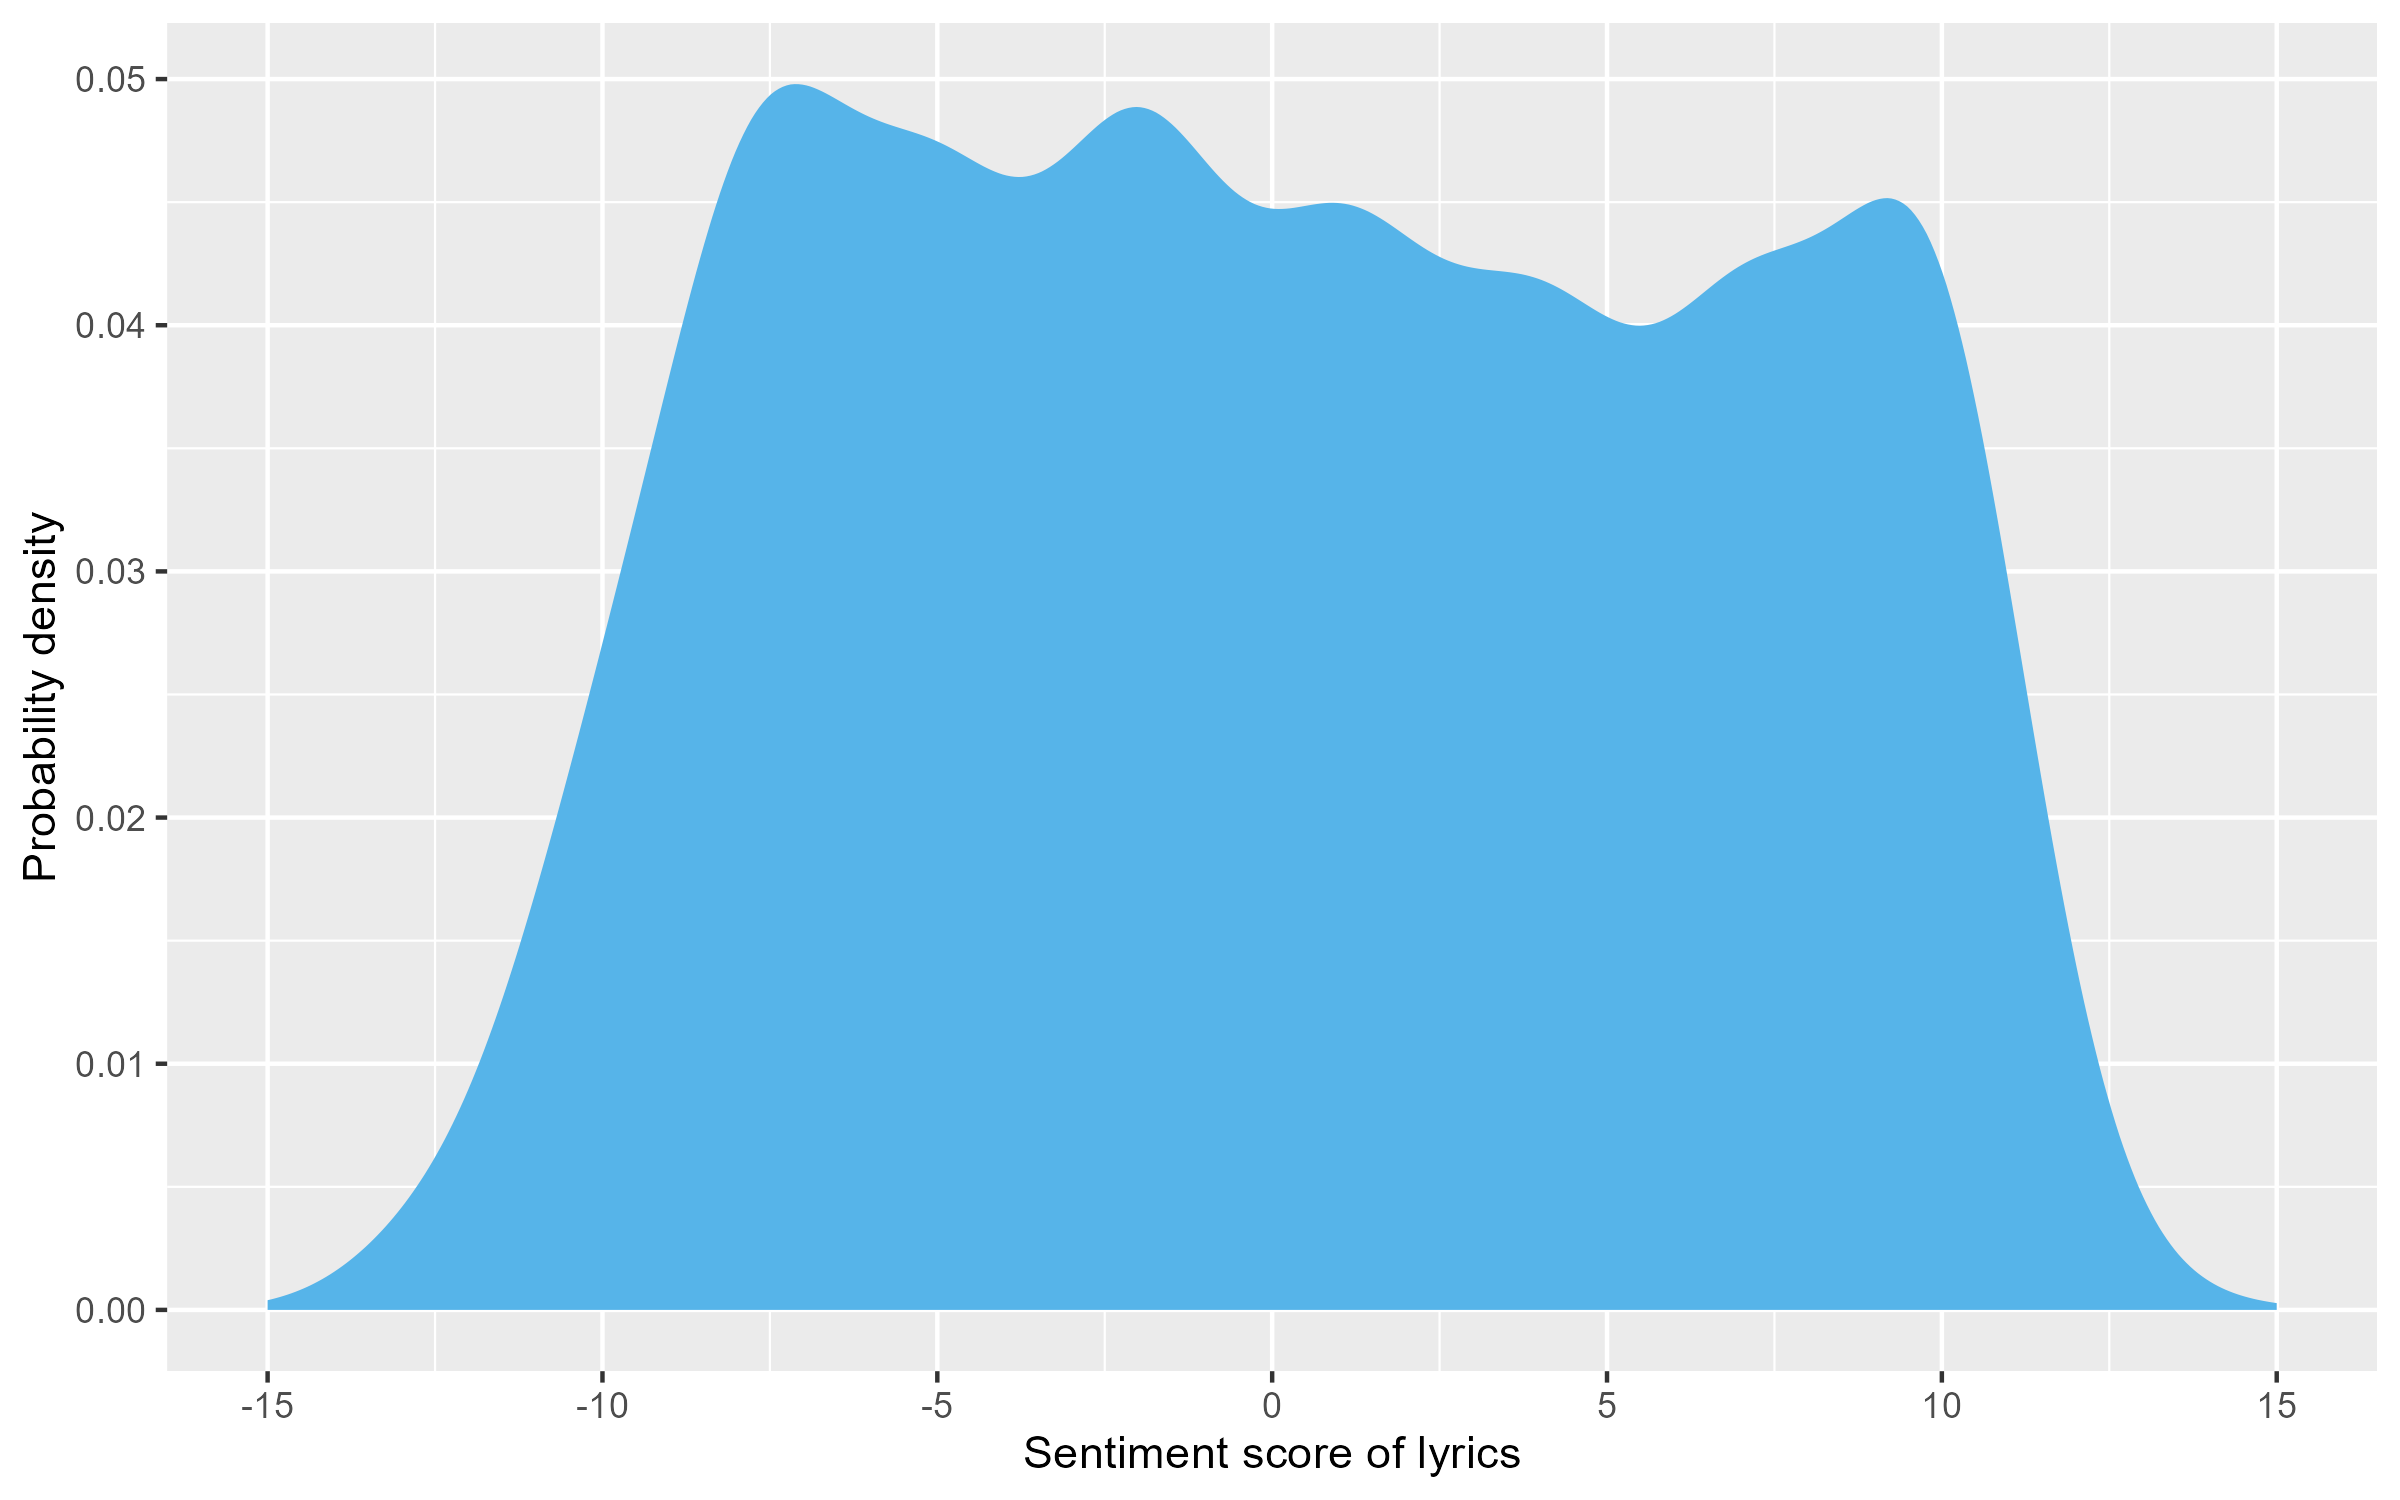
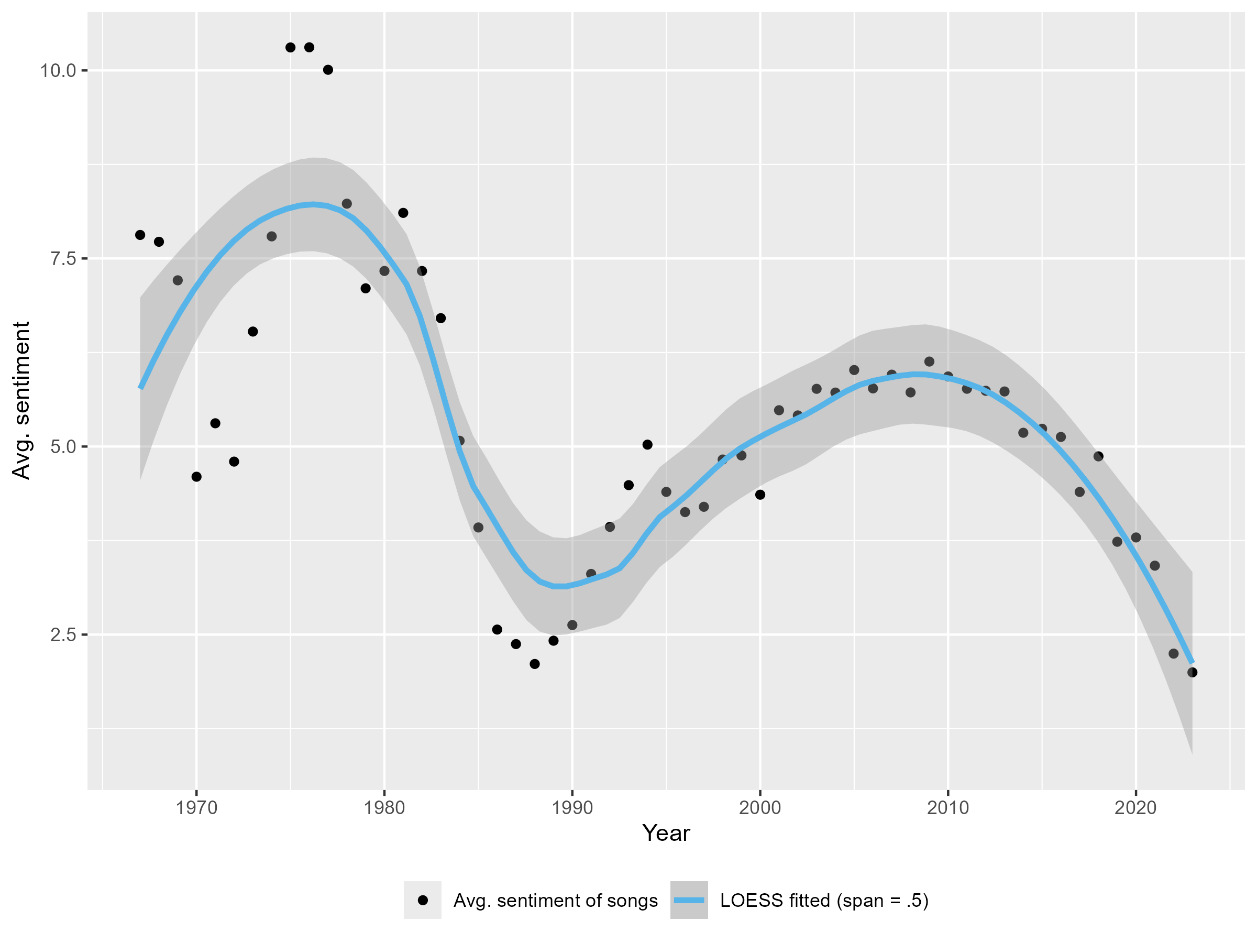
For example, for the trio of sadness, determination, and hope, S = (−1)*3 + 1*3 + 1*3 = 3, the emotional intensity of the three words being all equal to 3 by chance.[6] After calculating S for every song, average S over all the songs released each year, based on which the scatter plot in Figure 3 is plotted.[7] Figure 4 displays the distribution of lyric sentiment of all songs in the corpus, which forms a plateau within the mid-range of sentiment.

The emotion lexicon used in this study is based on the Chinese Sentiment Vocabulary Ontology Library (CSVOL) developed by the Dalian University of Technology (Xu et al.), which has been successfully adopted by studies on Chinese literary and social media sentiments (e.g., Zhang et al.; Y. Liu). There are 27,466 words included in the original CSVOL, and after expanding it by incorporating synonyms, the new lexicon used in this study has 38,237 words. (For how the lexicon was developed from the CSVOL, see Supplementary Materials 4.)
To cross-check the validity of this novel approach involving ChatGPT, the sentiment of each lyric is recalculated using the more conventional, lexicon-based sentiment analysis (see Appendix of this essay for an outline of that procedure), the result of which is presented in Figure 5.[8] Figure 5, demonstrating the lexicon-only approach, shows periodicity in sync with that in ChatGPT-assisted Figure 3: both waves have the same dual peaks in the late 1970s and around the year 2010, corresponding to two time points with the most positive songs on average, and both have the same nadir around the year 1990, the time with the least positive songs.[9] In addition, both figures exhibit oscillation with a dampening amplitude. Therefore, Figure 5 cross-validates the periodicity of lyric sentiment detected using the ChatGPT-assisted approach.
There are, however, some important differences between Figures 3 and 5. First, for the lexicon-only approach, Figure 5 shows a downward trend of the oscillation’s equilibrium position, which is absent in ChatGPT-assisted Figure 3. This means the former does capture some lower-level linguistic features that are abstracted away by ChatGPT. Second, in Figure 5, the average lyric sentiment remains positive throughout, whereas the average sentiment in Figure 3 oscillates around zero. Moreover, the Pearson correlation coefficient between the standardized ChatGPT-assisted sentiment scores and the lexicon-only ones for all songs is 0.53, suggesting only a moderate correlation. All these point to the fact that there is non-negligible difference between the sentiment scores generated by the two approaches.
To preliminarily evaluate both methods, 200 songs were randomly selected, and each lyric was manually judged and labeled as either “positive” or “negative.” These manual labels then served as the ground truth. Any computed sentiment score below zero was classified as negative, otherwise positive. The ChatGPT-assisted method correctly matched the manual labels 87% of the time, whereas the lexicon-only approach achieved 64% accuracy. (For full results, see Supplementary Materials 5.) This finding aligns with previous studies (Belal et al.; Sudirjo et al.; Campregher Paiva and Diecke) and, while not exhaustive, provides strong evidence for the ChatGPT-assisted approach’s superior predictive performance. Despite the differences, as shown later, the DHO model can encompass both cases in Figures 3 and 5, with or without the downward trend, but, for simplicity, the rest of this study focuses on the pattern in ChatGPT-assisted Figure 3.
3. Periodicity of lyric sentiment
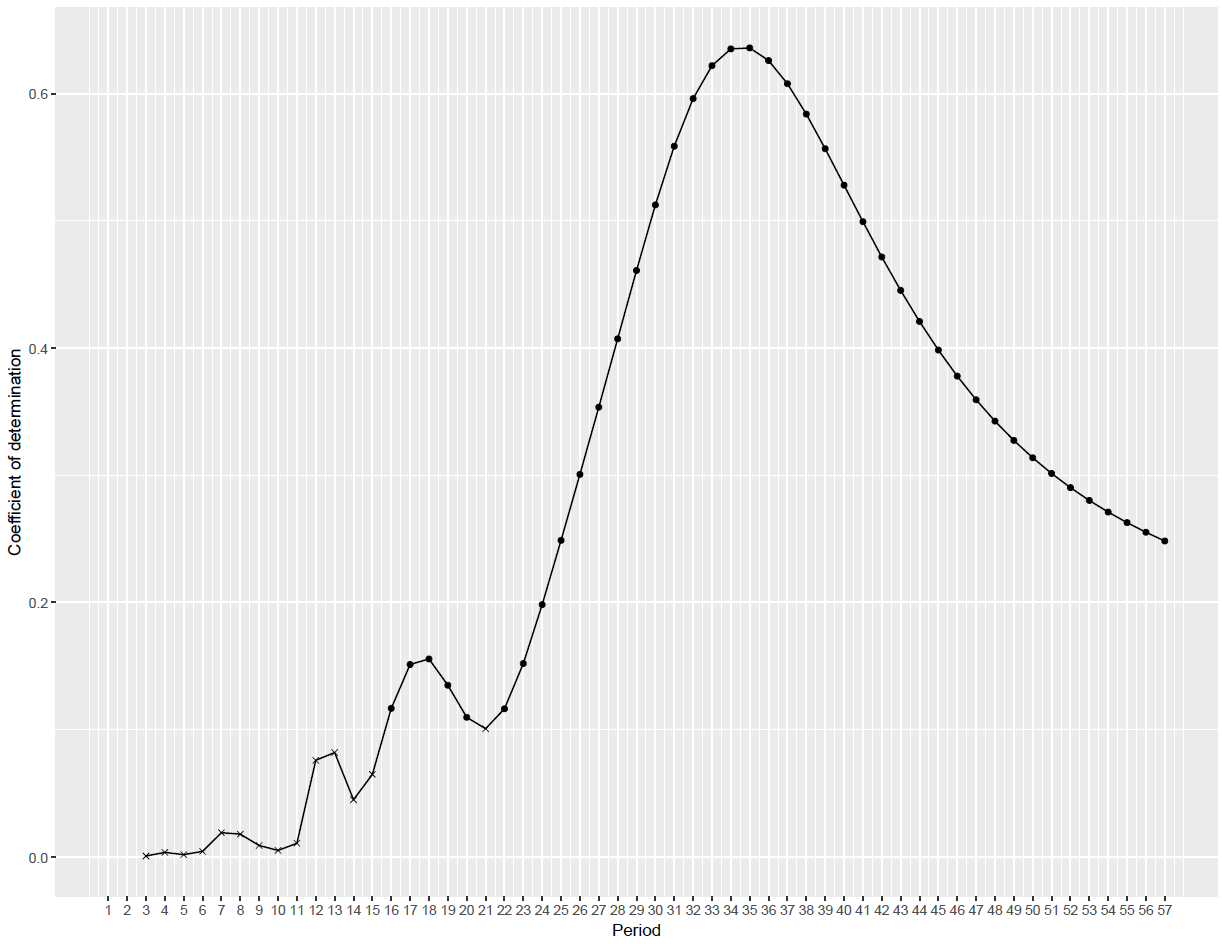
To more rigorously assess the sentiment periodicity captured in Figure 3, a spectral analysis (Bloomfield) is conducted and a periodogram (Klemfuss and Clopton) generated for the time series of the average lyric sentiment from 1967 to 2023. Figure 6 illustrates the spectrum of the time series through a Fast Fourier Transform (FFT) of the time domain data into the frequency domain.[10] It shows that there is a dominant low-frequency component (the peak) with an estimated frequency of 0.0333 period/year, which translates to an estimated period of 30 years. Note that since the sampling time window is not much longer than the estimated period (57 vs. 30 years), the resolution is rather low when detecting long periods at the low frequency end of the spectrum. Therefore, the period estimation is inaccurate. To obtain a more accurate estimate, a periodogram (Figure 7) is generated using the R package “Cosinor2” (Mutak). The rationale of the periodogram is as follows: each using a different period, fit a series of cosinor models (Cornelissen); calculate the variance of the time series explained by each fitted cosinor model with its specific period; plot the variances explained (coefficient of determination) against the series of periods used to estimate the models; and the period corresponding to the most variance explained (the highest coefficient of determination) is the best period estimate (Mutak). Figure 7 indicates a more accurate period estimate of 34 to 35 years.[11]


4. Modeling lyric sentiment cycles
To prepare readers for the technical part of modeling in this section, a non-technical overview of the intuition behind the DHO model is first provided. It is best to understand the DHO model through the swing of a pendulum as a classic example in Newtonian physics. The swing of the pendulum around the equilibrium position (the lowest point of the arc) is determined by two forces. The first is the restoring force, Fr, which always tries to bring the pendulum back to the equilibrium position, whenever the pendulum is away from that position, and is thus the driving force of the cyclic swing. The second is friction, or more commonly the drag, of the air, Ff, the damping force of the swing, which always resists the pendulum’s movement and consumes its mechanical energy, so that the amplitude of the swing diminishes over time (Walker 424–32). This characterization is consistent with the lyric sentiment trajectory observed in ChatGPT-assisted Figure 3. The total force exerted on the pendulum, F = Fr+ Ff, follows Newton’s second law of motion, F = ma, where m (the mass) represents the inertia of the pendulum and a is its instantaneous acceleration. Then, the key to modeling the lyric sentiment cycles is to specify the behavioral assumptions about what constitute the restoring force Fr, friction Ff, and inertia m in the pendulum system of lyric sentiment.
The restoring force is simply the market force. For an individual listener, the farther a lyric’s sentiment is away from the listener’s preference (favorite sentiment level), the less likely, or frequently, the listener would listen to that song. Aggregating these individual behaviors over all potential listeners, it follows that the farther a lyric’s sentiment is away from the average listener preference, the fewer listens, or “plays,” the song would receive. This voting power of listeners is the restoring force that always pressures lyricists (heavily or lightly) to adjust the sentiment of lyrics toward the average listener preference. Friction could come from multiple sources in the system that resist change, for example, the lyricists’ or record companies’ reluctance to change the current sentiment level of their lyrics being written. Inertia reflects the lagging tendency in the information-processing and decision-making processes of the pop music industry that tends to maintain the current momentum of change in lyric sentiment. Different from friction, which is resistance to change, inertia is second-order resistance to change in change, which is elaborated later. Inertia is the very reason why the pendulum—and the market—often overshoots and passes the equilibrium position instead of staying in it once reaching it.
This pendulum analogy often underlies statistical models of society’s cycles. In their modeling of cyclical changes in fashion in the length of women’s evening dress over centuries, for example, Lowe and Lowe posit that there is an “ideal” length for skirts that served as the equilibrium position, and some restoring force, damping force, and inertia together caused the slow, pendulum-like swing of dress length around the equilibrium. In modeling American national election cycles, Merrill et al. argues that such swing cycles can be explained by a) the restoring force of voters to penalize both liberal and conservative policies that are too extreme with respect to the political stance of the median voter (the equilibrium position) and b) the ruling party’s incumbency advantage and their tendency to maintain the momentum toward their set policy goal, that is, the inertia. However, those models are mostly statistical, and the pendulum intuition is never fully formalized, a drawback the current study aims to fix.
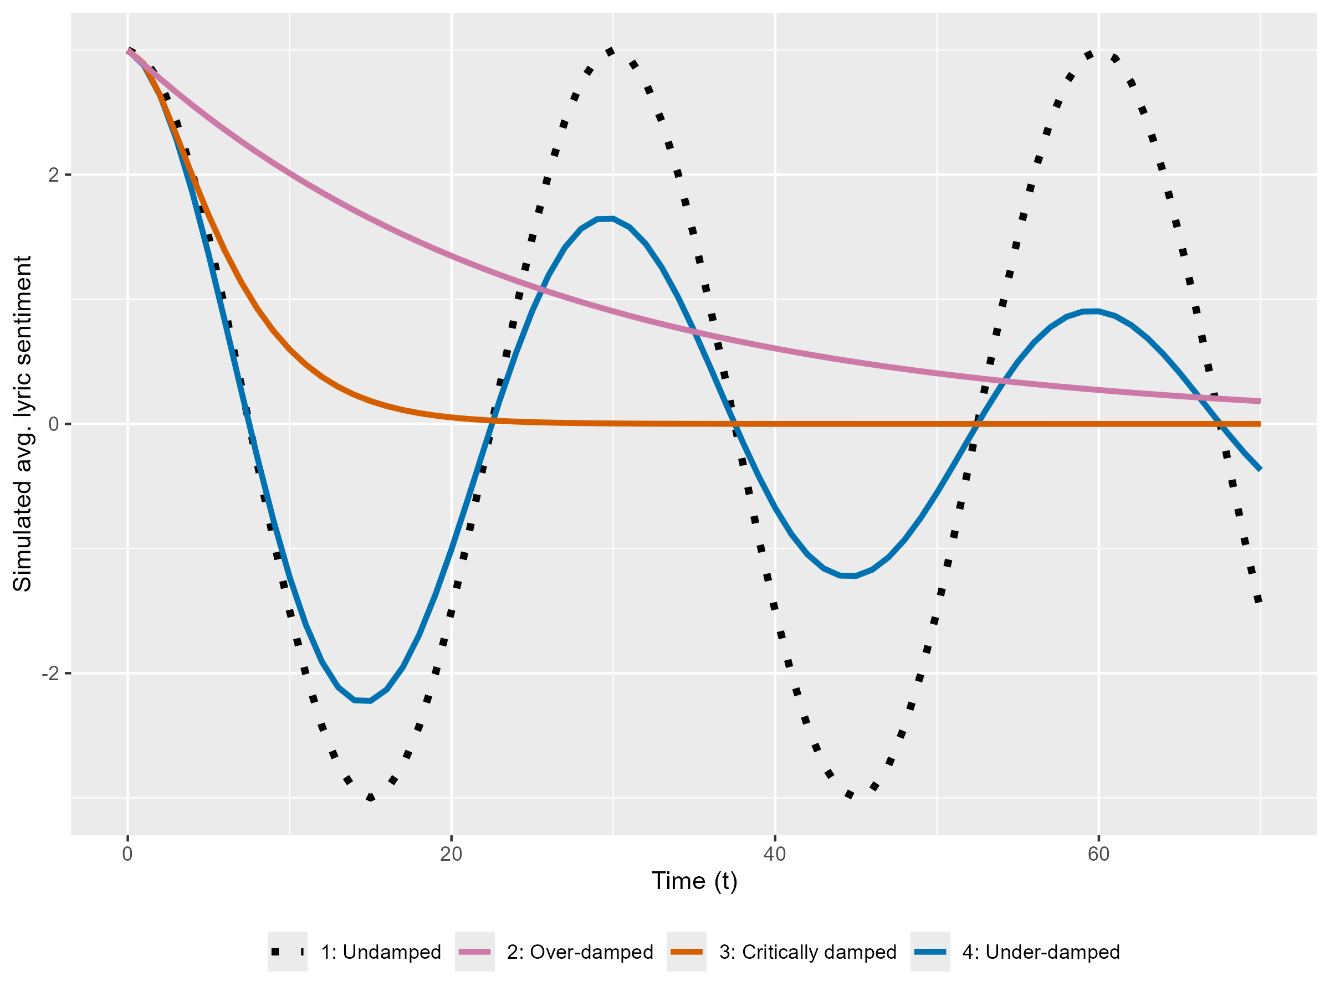
Note that damped periodic swing is only one of the two possible forms of motion a pendulum can take. If the pendulum is submersed in a viscous liquid with high friction Ff and is released from some off-equilibrium position, it will gradually settle down into the equilibrium position without periodic oscillation because the friction is so strong that it overwhelms, so to speak, the restoring force. This mode of pendulum motion could explain the monotone downward trend of lyric sentiment in English lyrics, which is elaborated later.

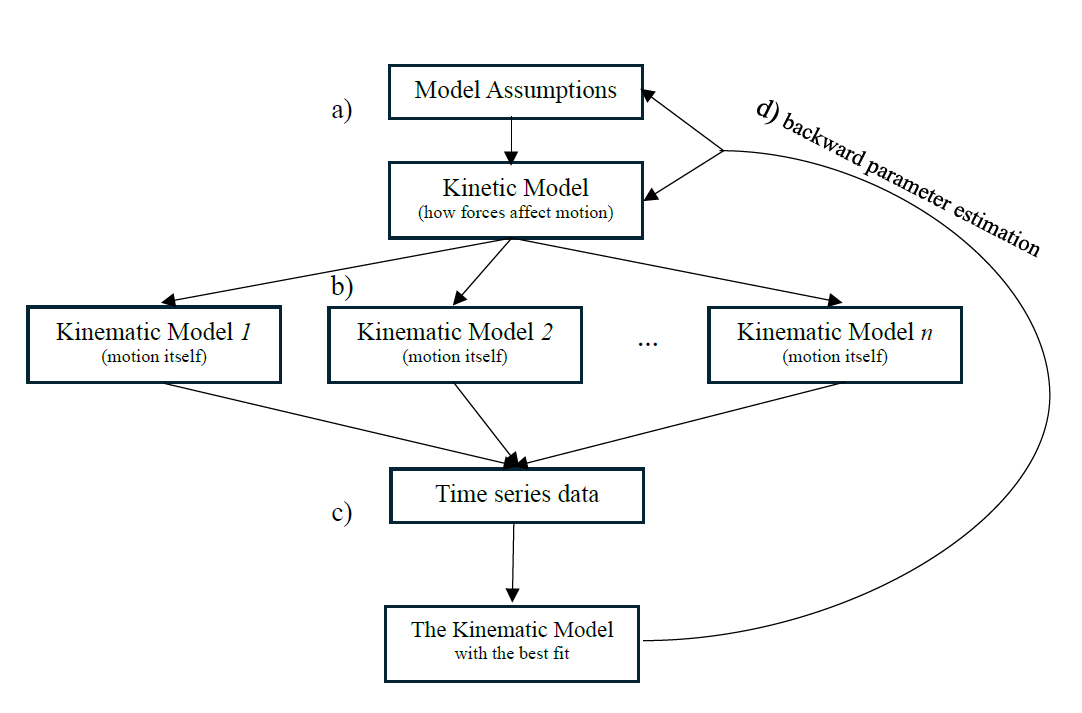
Referencing Figure 8, the rest of this article first, makes four modeling assumptions and deductively builds a kinetic model, exemplified in a), that explains how various forces may have caused the periodic motion of lyric sentiment. From that model issue a series of nested, kinematic models, exemplified in b), that describe the possible motions of lyric sentiment without considering the underlying forces that, exemplified in c), fit those kinematic models to the lyric sentiment time series data in order to inductively select the model with the best fit and that, as exemplified in d), use the estimated kinematic model parameters to go back to estimate the parameters of the underlying kinetic model.
By closely knitting together deductive and inductive modeling, this middle approach may strike a balance between the ability to generalize (with the kinetic model) and that to explain and predict a particular case (with the kinematic models).
4.1. The kinetic model: a special tug-of-war
Assumption 1 (stage setup): locally uniformly distributed listener preference
For simplicity, assume, Sa, the sentiment preference of each listener—the single most favorite lyric sentiment level of each listener—follows a uniform distribution, with constant probability density d, over a local sentiment range [s1, s2] that covers the range of the oscillation of the average lyric sentiment, and such a distribution is relatively stable over time (Figure 9):[12]
Sa ∼ U([s1,s2],d).
Assumption 2 (restoring force): listeners’ tug-of-war
The average lyric sentiment of all the songs released in a given year can be likened to the temporary position of the red tape marked at the middle of the rope used in a tug-of-war game. The movement of the yearly average lyric sentiment is then analogous to the movement of the red mark in the game (Figure 9). Every listener is a player. Each player located right to the red mark (whose sentiment preference is more positive than the current average lyric sentiment) applies the same “force,” f (representing the listener’s voting power), to pull the rope and thus the red mark rightward, hoping to make the average lyric sentiment more positive (closer to their own preference); then there is the total rightward force, Fp = f*Np, where Np is the number of players right to the red mark. Similarly, the total leftward force, Fn = f*Nn, where Nn is the number of players left to the red mark. Assuming Fp> Fn, then the red mark would move rightward. However, different from the regular tug-of-war, in this special version the players do not move (due to Assumption 1, stable sentiment preference), and only the red mark (and the rope) moves. This means that as the red mark moves rightward, Np decreases and so does Fp, the total rightward force. At the same time, Nn increases and so does Fn, the total leftward force (Figure 9). It follows that at a certain point, the rightward force would become weaker than the leftward one, Fp< Fn, which means the red mark would start to reverse its course to move leftward, and so on. This is the essence of the lyric sentiment cycles.
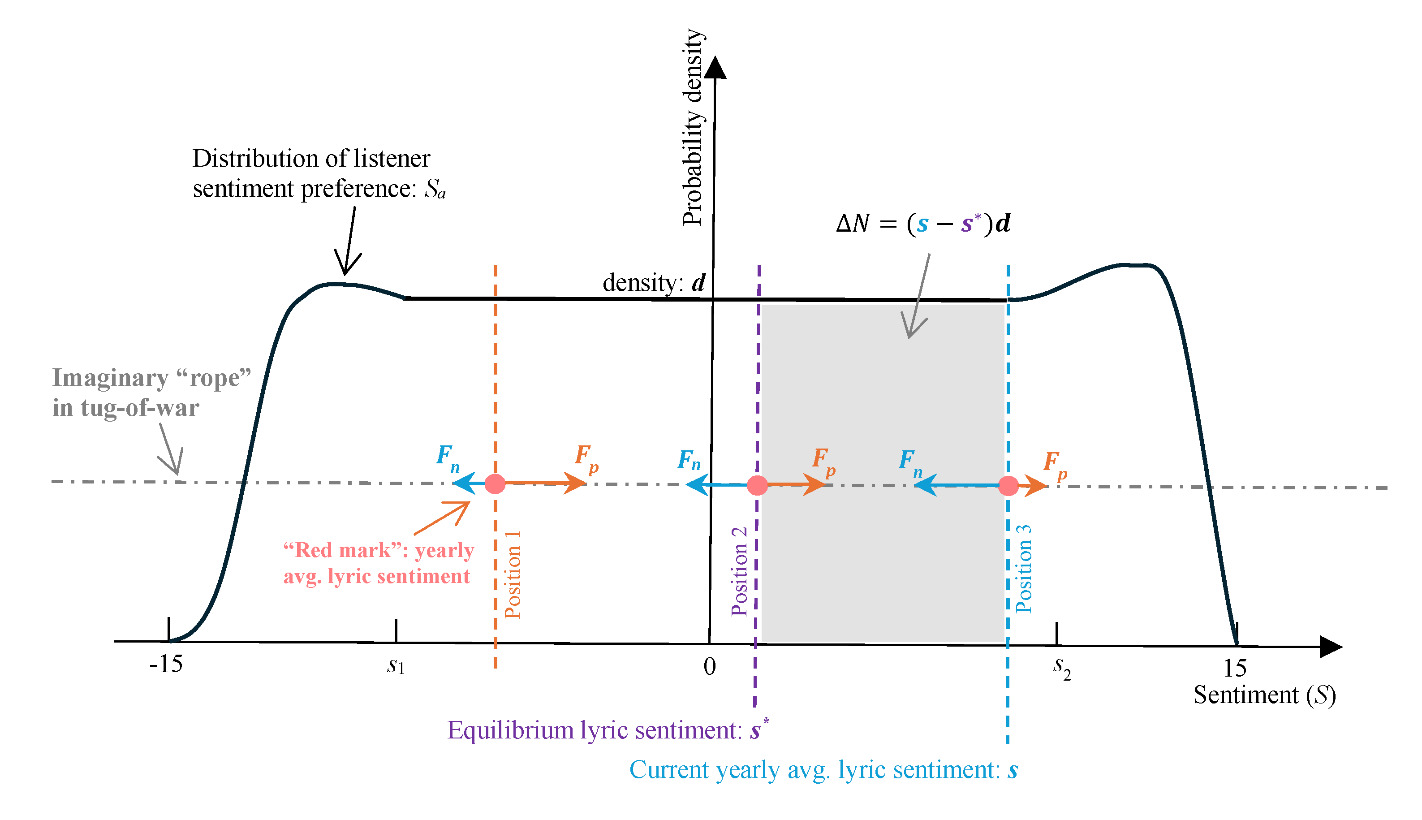
In equilibrium, Fp= Fn, implying N*p = N*n= 0.5N, where N is the total number of listeners. This suggests the equilibrium position of the average lyric sentiment, is the median of the distribution of listener sentiment preference Sa. Then, for any position of the average lyric sentiment the rightward force Fp= fNp = f[N*p – d] = 0.5Nf – and the leftward force Fn= fNn = f[N*n + d] = 0.5Nf + (e.g., position 3 in Figure 9). It follows that the net force Fr, exerted by all players on the rope, and thus the red mark, in the lyric sentiment position s is:
Fr=Fp−Fn=−2fd(s−s∗)=−k(s−s∗),with k≜2fd>0,
where k is called the elastic coefficient. That is, the net force Fr is proportional to the distance between the current average lyric sentiment s and the equilibrium sentiment Because Fr always points from s toward the equilibrium position (due to the negative sign), it is the restoring force.[13]
Assumption 3 (friction): general systemic resistance
Assume there is some general systemic friction Ff, or resistance to change in lyric sentiment that could come from multiple sources in the pop music market. For example, the lyricists could be reluctant to change their current sentiment level of lyric; or the record companies could resist change. It is assumed that the friction Ff is proportional to the rate of change in average lyric sentiment (first derivative of s over time t)—the faster the change, the greater the resistance—and always points in the opposite direction of the change:
Ff=−hdsdt, with h>0,
where h is called the damping coefficient.
Assumption 4 (inertia): lyricists’ inertia
Lyricists are not immediately responsive to the sentiment demand of listeners, because of time lag, incomplete market information, or their own artistic agendas. This translates to the “inertia” of the average lyric sentiment, defined as its tendency to maintain the current momentum. Note that this Newtonian definition of inertia does not mean resistance to change (as in Assumption 3), but rather the resistance to change in change. Let m denote inertia, so from Newton’s second law of motion, the second derivative of lyric sentiment s over time t (or acceleration, rate of change in change) has the following relation with F, the total force upon lyric sentiment:
F=md2sdt2, with m>0,
The three Equations (3) (4) (5) define three forces—the restoring force Fr, friction Ff, and the total force F, respectively—which follow the trivial relation:
F= Fr+Ff
The system of Equations (3) through (6) constitutes the kinetic model of the lyric sentiment cycles.
4.2. Kinematic models
The parsimony of the kinetic model above can be best seen in its kinematic form in which the force terms are eliminated. Plugging Equations (3) (4) (5) into (6) gives[14]
d2sdt2+2βdsdt+ω2s=0,
where representing the system’s susceptibility to friction, and the system’s restoring tendency. This standard, second-order linear homogeneous differential equation with constant coefficients is the key to all the other equations in this article. It is the DHO model—the same one that describes the damped swing of a pendulum—which has analytical solutions (Szeidl and Kiss 61–65). There are three possible solutions to this equation (for formal derivation, see Supplementary Materials 6), depending on the relative magnitudes of and that is, the damping ratio
Overdamping
If there is no oscillation, because friction Ff is the dominant force in the system, which overwhelms the restoring force Fr—the driver of oscillation (Figure 10). Further, if and the initial conditions at t = 0 are and there is
s(t)≈A⋅e− ω22βt,
which is an exponentially, monotone decreasing trend (if with
Critical damping
If friction and the restoring tendency are in balance, there is still no oscillation (Figure 10). With the same initial conditions as above, there is
s(t) = (1 + \beta t)A \cdot e^{- \beta t}.\tag{9}
This is also a monotone decreasing function (if with
Underdamping
If the restoring tendency is dominant, and oscillation starts:
s(t) = A{\cdot e}^{- \beta t}cos(\frac{2\pi}{T}t - \varphi), with \ period \ T \triangleq \frac{2\pi}{\sqrt{\omega^{2} - \beta^{2}}},\tag{10}
where A is the initial amplitude of oscillation, T the period, the phase shift, and
Figure 10 shows the simulated trajectories of all three scenarios. Now it becomes clear that the monotone downward trend detected in English lyrics (Figure 1) could be subsumed into the special case of critical or overdamping, where the underlying listener preference distribution remains stable across time (Assumption 1).

In the case of Chinese lyrics, underdamping (Equation 10) is relevant. Up to this point, the model building process is mostly deductive, but the rest turns more inductive. To make Equation (10) more general and turn it into a statistical model, first, a linear trend in the equilibrium position B is added, implying a shifting listener sentiment preference (as seen in Figure 5); second, a linear trend in the period T is included as well, suggesting that the period could change over time:
s(t) = Ae^{- \beta t}\cos\cos\ \left( \frac{2\pi t}{T + Dt} - \varphi \right)\ + (B + C \cdot t) + \varepsilon_{t},\tag{11}
being the error term at time t, which is assumed to be independently, identically normally distributed with mean 0 and variance
In addition, a numeric solution to differential Equation (7) can be obtained by turning it into a difference equation. Substituting for s, for and for in Equation (7) yields:
\small s_{t} = \omega^{2}s^{*} + \left( 2 - \omega^{2} - 2\beta \right)s_{t - 1} + (2\beta - 1)s_{t - 2} + \varepsilon_{t}\text{, with }t = 2, 3, 4,... \tag{12}
Then, re-parameterize as
s_{t} = B + G \cdot s_{t - 1} + H \cdot s_{t - 2} + \ \varepsilon_{t}\text{, with }t = 2, 3, 4,...\tag{13}
which is a second-order autoregressive model commonly used in time series analysis (Merrill et al.; Norpoth). Equations (11) and (13) are the basis of the statistical models estimated in the next section.
5. Model estimation, comparison, and selection
Equation (13) and special cases of Equation (11), obtained by setting certain model parameter(s) to zero, are estimated in the R environment using the time series of average lyric sentiment, the results of which are summarized in Table 2. Models 1 through 6 are variants of Equation (11), and model 7 corresponds to Equation (13) (auto-regression). In addition, as two points of reference, the baseline model (simple mean) with the poorest fit, and the LOESS model (Locally Estimated Scatterplot Smoothing, span = 0.5) with about the highest fit (but with possible overfitting), are also included.[15]
Model 1 is estimated using the “cosinor” package in R (Sachs), which is based on a procedure that transforms the undamped, cosine model into a linear one when period T is known (set to 34 years in this case), so that the Ordinary Least Squares (OLS) procedure can be utilized (Cornelissen). Model 7 is fitted with the LOESS-smoothed data of lyric sentiment, which follows a standard procedure of second-order auto-regression. The other models in-between (2 through 6) cannot be estimated using any linear method due to their nonlinearity. To address this, I developed two alternative estimation procedures in R specifically for them, one based on Maximum Likelihood Estimation (MLE) and the other on Nonlinear Least Squares (NLS) (Monahan 219–56; Merrill et al.). It turns out that the point estimates by MLE and NLS are essentially the same, but MLE generally gives larger standard errors. Therefore, to be conservative, Table 2 includes only the MLE estimates, with standard errors in parentheses.[16]
Two measures of model fit are calculated for each model, the Standard Error of Regression (SER) and the Sum of Squares of Errors (SSE). When selecting the best fitting model, those two measures should be balanced with the principle of parsimony. Overall, Model 3 has a good balance between fitness and parsimony, but the standard error of parameter B (the equilibrium sentiment) is too high relative to its point estimate, which means the interval estimate for B encompasses zero. Therefore, for parsimony, Model 2 (Model 3 without parameter B), corresponding to Equation (10), is selected as the best fitting model. Figure 11 illustrates the fitness of three selected models, showing that the parametric Model 2 with only four parameters can approximate the nonparametric LOESS trajectory reasonably well. The correlation coefficient between Model 2–predicted average lyric sentiment scores and the LOESS-predicted ones is 0.98, and that between Model 2 predictions and the actual ones is 0.82, both with a practically zero p-value. This attests to the explanatory power of the DHO model.[17]

6. Discussion and Conclusion
The parameter estimation of Model 2 provides fresh insights into the nature of the sentiment dynamics in Sinophone pop lyrics. Based on the estimates = 0.014 and = 34.50, according to Equation (10), the parameter (called the system’s natural angular frequency in physics) can be estimated as the square root of which is 0.18. Then the estimated damping ratio is = 0.014/0.18 = 0.078 < 1, thus confirming the underdamping condition. Recall that a ratio of the damping coefficient to the system’s inertia, and (square root of) a ratio of the system’s restoring tendency to inertia (Equation 7); thus, the damping ratio reflects the system’s relative susceptibility to friction vis-à-vis that to restoration (with respect to a given inertia level m).
In the case of Chinese lyrics, the damping ratio being less than one suggests that a) the system is not very susceptible to friction (small h), meaning, for instance, lyricists or record companies are not very resistant to changing their lyric sentiment levels based on market feedback, or b) the system has a strong restoring tendency (large k): listeners are very sensitive to the deviation of the average lyric sentiment from their favorite levels and willingly exert their voting power to pressure lyricists to adjust accordingly, or both a) and b). As a result, the restoring tendency is the more dominant one and causes lyric sentiment to oscillate around the equilibrium position.
By contrast, in the case of English lyrics, the monotone downward sentiment trend may suggest the opposite: critical or overdamping with (Figure 10). A greater-than-one damping ratio means that a) lyrists and record labels are more reluctant to change their current lyric sentiment levels (large h), or b) listeners are less sensitive to the deviation of the average lyric sentiment from their favorite levels (small k), or both. In this case, friction is the more dominant tendency in the system and thus inhibits the oscillation of lyric sentiment.
In both scenarios, distributions of listener sentiment preferences are assumed to be largely stable over time, and the different movements of the average lyric sentiment, periodic or monotone, are mainly the results of the differing equilibration processes of the Sinophone and Anglophone pop music markets, the former underdamped and the latter critically or overdamped.
This contrast between the dynamics in the Anglophone and Sinophone pop lyrics may be explained by the different production and consumption modes in the two mass cultural markets. On the production side, the West from the 1960s onward came to value self-expression and authenticity in pop music and thus equate an artist’s personal authorship—music and lyrics—with sincerity and integrity; for example, the rise of rock and folk genres through figures like Bob Dylan and the Beatles foregrounded the artist-as-author as the primary site of authenticity (Firth; Moore). By contrast, the Sinophone pop industry, during its formative decades (1960s and onwards), was influenced by a song factory model: Taiwanese and Hong Kong record companies routinely imported melodies from Japan and the West and then commissioned specialist lyricists to craft fitting words, resulting in an assembly line–like division of labor among the composer, the lyricist, and the singer (Tsai et al.; Jones; Moskowitz; Chu). This divide between the Western independent-artist mindset (priding itself on authentic self-expression, at least ostensibly) and the Sinophone lyric-manufacturer mindset (focusing more on market sales) may have made the latter more responsive than the former to market feedback (smaller h). On the consumption side, compared with Western listeners, Sinophone counterparts invest more in the emotional contents of lyrics than in the music of songs (Moskowitz), which makes Sinophone listeners more sensitive to the deviation of lyric sentiment from their preferences (greater k).
Questions and critiques may arise concerning this theoretical model built on the equilibration interpretation. Many may have the impression that music listeners can be quite “fickle” in terms of their tastes in musical styles and lyric contents, as evidenced by the rise and fall of various genres and topics across generations. Even at the individual level, a listener can easily get bored by listening to a single genre or theme and may gravitate toward new options. Then, how can one reconcile this perceived listener fickleness with the assumption of stable sentiment preferences? The response to this question is twofold. At the individual level, listeners’ fickleness in style and content preference is not inconsistent with their stability in sentiment preferences (Stigler and Becker). As an analogy, a person’s favorite type of dessert (similar to genre or topical preference) may change relatively easily, but at a more fundamental level, the person’s favorite degree of sweetness (similar to sentiment preference) may be stable across time. For example, studies have shown that a person’s personality traits predict their sentiment preference in music (Rentfrow and Gosling; Garrido 101–104); then, if a person’s personality is stable, it is reasonable to believe that their sentiment preference does not vary much. Moreover, the stable sentiment preference assumption does not require the preference to be stable at the individual level; rather, it posits that the distribution of sentiment preference is relatively stable within the population of listeners (just like assuming the distribution of preference in sweetness is largely stable across generations), which is a less stringent assumption.
Some might question the empirical validity or generality of the local-uniform-distribution assumption of listener preference (Assumption 1). Yet, this property can be quite common within a neighborhood around the equilibrium position, like the peak or nadir, of many distributions, where the first derivative is zero, which indicates a locally near-flat, and thus uniform, surface.
A limitation of this study is that lyrics contain only part of the emotional information of songs, and thus focusing on lyrics misses emotional content in the music itself. Admittedly, the emotions captured by lyrics are incomplete. Nevertheless, both quantitative and ethnographic studies have demonstrated that from the perspective of listeners, lyrics are more emotionally meaningful than musical features of songs, especially in the Sinophone case (e.g., Garrido 255; Moskowitz 112).
Another limitation is that collapsing the multidimensional sentiment space of lyrics onto a single negative-positive dimension is an oversimplification of the complex emotional phenomena in lyric expressions. Indeed, this study’s scope of sentiment analysis is quite limited. However, in analyses not shown here, measures of specific emotions in Sinophone lyrics—such as “joy,” “sadness,” “disgust,” and “liking”—exhibit similarly periodic patterns. A comprehensive mapping of the emotion-scape in Sinophone pop lyrics is, however, covered in a separate article (Wang and Wong).
Some might also argue that music making and listening are social activities; a person’s musical choice can be influenced by peers through imitation and/or differentiation (Acerbi et al.; Brand et al.; Bentley, Lipo, et al.). It is true that in the tug-of-war assumption (Assumption 2), the decision-making of listeners is independent, ignoring interactions among themselves. Yet, as the model fitting section has demonstrated, the current model tracks the overall periodic trajectory of lyric sentiment quite well. Thus, it is possible that this DHO model, which considers only the interaction between lyricists and listeners, is adequate in capturing the “tide,” but if the goal is to trace out the wavelets riding the tide, a more nuanced model is needed to consider social interactions among listeners and among lyricists.
It needs to be emphasized that this study does not refute the mirror interpretation, which assumes average lyric sentiment tracks average listener preference. Indeed, under the mirror interpretation, the periodicity of lyric sentiment may be explained by a corresponding cyclic motion of average listener preference, but then a theory is needed to explain the underlying sine-wave form of listener preference movement. Such a candidate theory typically involves game theory and agent-based modeling, which are subject to some serious limitations due to the lack of operationalism mentioned in section 1.2. By contrast, the current model can achieve considerable explanatory power through a parsimonious Equation (7) and a single, accompanying damping ratio, which is superior according to the principle of parsimony (i.e., Occam’s razor). The goal of this study is similar to that of economists George Stigler and Gary Becker (two Nobel laureates), who also argued for the methodological effectiveness of the stable preference assumption by taking “categories of behavior commonly held to demonstrate changes in tastes or to be explicable only in terms of such changes, and show both that they are reconcilable with assumption of stable preferences and that the reformulation is illuminating” (77).
Nevertheless, the cyclic case of Chinese lyric sentiment lends support to the equilibration interpretation; the reasoning involves four steps. First, by law of physics, cyclicity like the sine wave implies that there is a (relatively) stable equilibrium position around which the lyric sentiment oscillates. Second, under the market mechanism (i.e., interactions between producers and consumers), that equilibrium position corresponds to the average listener sentiment preference. Third, since the former is stable, the latter must also be stable. Fourth, now that the average listener preference is stable, the oscillating, changing lyric sentiment cannot reflect the (stable) average listener preference but must equilibrate toward and around it; hence, the equilibration interpretation. If it is further assumed that most pop music markets follow similar market mechanisms, then it is likely that this equilibration interpretation also applies to other cases, cyclic or not. That said, to ultimately adjudicate between the mirror and equilibration interpretations, future research is needed that focuses on testing related hypotheses. In the end, the mirroring and the equilibrating mechanisms are not mutually exclusive; they can coexist in the same case, as in the hybrid interpretation.
Lastly, questions may arise that since the current DHO model is developed based on Chinese lyrics, which perhaps only by chance exhibit a cyclic sentiment pattern, to what extent then can the model be generalized to account for cases of other pop music markets (e.g., Korean and English pop lyrics) and markets of other cultural products (e.g., literature). The response to this question is threefold. First, cyclic patterns may be more common than usually perceived in the sentiment dynamics of textual cultural products. It is just that a researcher who is accustomed to linear regression, when facing a scatter plot like Figure 5 “Periodic trajectory of the yearly average lyric sentiment,” would tend to fit a simple linear model, which captures only the downward trend but misses the oscillatory component that is not noise but part of the signal. For example, in the case of K-pop lyrics (Jo and Kim), some emotions and emotional topics display clear cyclic patterns riding on linear trends (Figure 1b 1662; Figure 3 1664), but only linear Pearson correlation coefficients were calculated. For literature (Morin and Acerbi), sentiment cyclicity also exists in varying degrees in the literatures of many major European languages (Figure 3a 5; Figure 4 10), but, again, only simple linear regressions were fitted. This naïve methodology might have underestimated the empirical prevalence of cyclicity. Second, as already shown, even monotone trends could be explained by the DHO model. Regarding this, a prediction derived from the model is that for a monotone, decreasing sentiment trend (critically or overdamped), it should gradually level off (Figure 10 “Simulated trajectories”). This feature has been confirmed by the cases of English pop lyrics (Figure 1) and English literature (Morin and Acerbi 9–11), with Morin and Acerbi proposing a “regression-to-the-mean” explanation for this tapering-off, which is consistent with the logic of the DHO model. Third, although this study is motivated by the case of Chinese lyrics to build the DHO model, the modeling rationale is not narrowly limited to the Chinese case; rather, the model imitates the general market mechanism—the supply-and-demand-like interaction between producers and consumers—that drives most mass cultural markets. This is the deeper reason why the DHO model could explain both cyclic and monotone sentiment dynamics: just as in physics, a swinging pendulum, a ball in freefall, and a planet orbiting the sun all follow the same Newtonian laws of motion.
As a general implication, this study has theoretically and empirically distinguished the movement of sentiment in mass cultural products and that of consumer sentiment preferences. Figure 5 “Periodic trajectory of the yearly average lyric sentiment” epitomizes this point. The trajectory has two components: the equilibrating component represented by the oscillatory movement and the mirroring component represented by the linear decreasing trend of the equilibrium position. Both components could also possibly coexist in the monotone downward trend of English lyric sentiment (Figure 1). For example, based on Equation (8) (overdamping), it is natural to generalize it as
s(t) = A{\cdot e}^{- \ \frac{\omega^{2}}{2\beta}t} + (B + C \cdot t),\tag{14}
where the first term is the equilibrating component, and the second the mirroring one. Yet, due to the absence of oscillation in this case, a typical analyst, when looking at Figure 1, would be more likely to run a simplistic linear regression rather than to specify a more appropriate model that incorporates both components (like in Equation 14).
Practically, readers can use the framework laid out in this article as an analytical workflow. (1) Apply the LLM-plus-lexicon procedure to obtain sentiment time series; (2) if the time series exhibits a clear, monotone or sine-wave-like cyclic trend, estimate DHO-type models (in nested forms) to possibly disentangle the mirroring and equilibrating components; and (3) interpret the estimated damping ratio of the equilibrating component as evidence about the restoring tendency vs. systemic friction in a given cultural market and in its mode of production and consumption. Because the model generalizes beyond the case of Chinese lyrics, it can guide comparative analyses of other pop-music markets (e.g., K-pop, Anglophone) and other cultural products such as literature, where cyclic or monotone trends have been reported. Note that the framework accommodates the leveling-off of long, monotone declines and allows a two-component (equilibrating and mirroring) decomposition even when oscillation is absent. If the observed time-series pattern is more complex and does not exhibit an apparent monotone or sine-wave-like trend, more sophisticated analytical methods—such as generalized additive models (Wood), wavelet analysis (Mallat), Fourier or Laplace-transform analyses (Oppenheim et al.)—are recommended. In sum, this study highlights the need for moving beyond simple linear models in cultural analytics and provides an alternative strategy of modeling producer–consumer interactions that generate certain temporal patterns while avoiding over-attributing trends in cultural artifacts to shifts in collective psychology.
Data Repository: https://doi.org/10.7910/DVN/BV6QYX
Peer reviewers: Alberto Acerbi, Federico Pianzola
Acknowledgements
I gratefully acknowledge the generous research funding from the Dickinson College Research and Development Committee. For technical support with data collection and preparation, I sincerely thank my research assistants Liwen Li and Evan Wong. I also thank two anonymous reviewers for their constructive comments.
Data availability
The datasets analyzed during the current study are available in the Harvard Dataverse repository at https://doi.org/10.7910/DVN/2Q0QFM.
Author contributions
This article is authored by a single contributor.
Competing interests
The author declares no competing interests.
Ethical approval
This article does not contain any studies with human participants performed by the author.
Informed consent
This article does not contain any studies with human participants performed by the author.