


Sylvia Beach’s Shakespeare and Company, once a hub for the Lost Generation, has become iconic in popular culture. The continued cultural prominence of the bookshop and lending library is no accident. Beach knew that publishing James Joyce’s Ulysses (1922) would make Shakespeare and Company famous. Her memoir, published in 1959, is an exercise in name-dropping. She celebrates her relationships with writers, from Joyce to Gertrude Stein, and from Ernest Hemingway to Richard Wright. And subsequent memoirs from lending library members, as well as the voluminous scholarship on this era, has only reinforced the cultural significance of Shakespeare and Company. But for all this fame and scholarly attention, much about the bookshop and lending library remained unknown—until recently. With the release of the Shakespeare and Company Project (hereafter the Project), questions that had been difficult to answer have now become almost trivial due to the scale and quality of the data. But with this new computational potential to study Shakespeare and Company, new challenges have arisen. Beach was far from a perfect record keeper, and her records have not been perfectly preserved, even for some of her most famous patrons. Hemingway, for example, joined the lending library in 1921, but records of his borrowing history do not begin until 1925. So, while the release of the Project provides an unprecedented window into Shakespeare and Company and its community of patrons and mentors, it does so unevenly. As a result, the Project provides an opportunity to explore a phenomena that is endemic to humanistic scholarship, if not all knowledge production: missing data.
There are always boundaries and gaps in the evidence we use for cultural analysis, whether due to the original limitations in our source materials, or due to larger structural forces that, whether intentionally or not, determine what gets preserved as cultural heritage. But this new era of large-scale datasets, though perhaps providing more comprehensive and accessible information, also can counter-intuitively elide what is missing through sheer scale. This dynamic is at the heart of Mimi Onuoha’s The Library of Missing Datasets, which asks us to consider what and why data may be missing or unknown. Itza A. Carbajal and Michelle Caswell’s work also argues that scholars need to engage archival theory around digital archives because “archival silences are magnified in digitization projects.” “[W]hat users see in an ostensibly finalized digital repository,” they write, “represents many layers of appraisal decisions, many records that did not make the digitization cut, and, subsequently, an exponential multitude of silences” (1108). The Shakespeare and Company Project by-and-large heeds these injunctions. In the article “Shakespeare and Company Project Datasets,” Joshua Kotin and Rebecca Sutton Koeser provide an overview of the Project’s missing data, as well as how Beach and her assistants shaped what remains of the Shakespeare and Company archive. “[R]esearchers,” they advise, “should keep in mind that the sources reflect the work of a small and overwhelmed lending library staff, keeping records to facilitate the day-to-day operation of a business, not the work of future literary historians and data scientists” (11). Yet even with this transparency, missing data remains a reality for scholars seeking to understand the Shakespeare and Company lending library and actually use Project data. Although Kotin and Koeser’s advice is essential for researchers, we agree with Miriam Posner’s assessment: “if you can analyze something computationally … it’s going to be really hard to tell people that they shouldn’t.”
In this article, we consider the extent of “missingness” in the Project to offer researchers preliminary estimates of how it might influence their analyses, and to explore methods for computationally modeling missing data. Some of the methods we use, such as forecasting and recommendation systems, are well-established outside the humanities for grappling with and imputing missing data, but have yet to be utilized extensively in digital humanities.[1] We also propose an alternative approach to studying the Shakespeare and Company lending library, one that is both familiar and foreign to humanists and digital humanists—an approach we term “speculative reading.” In contrast to “distant reading,” “speculative reading” describes a way of modeling missing data, while remaining open to new ways of imagining and theorizing the archive—in this case, the communities that shaped Shakespeare and Company.
Speculation has long been a staple of how humanists explore the past—especially those working with incomplete materials. As Saidiya Hartman describes in Wayward Lives (2019), “I have pressed at the limits of the case file and the document, speculated about what might have been, imagined the things whispered in dark bedrooms, and amplified moments of withholding, escape and possibility, moments when the vision and dreams of the wayward seemed possible” (xiv–xv). Such an approach might seem antithetical to computational research; after all data is inherently an abstraction that often sacrifices specificity for aggregation. But as Johanna Drucker and Bethany Nowviskie argue, “speculative approaches make it possible for subjective interpretation to have a role in shaping the processes, not just the structures, of digital humanities. When this occurs, outcomes go beyond descriptive, generative, or predictive approaches to become speculative. New knowledge can be created” (442). Our approach is also inspired by Ryan Cordell’s recent call for “speculative bibliography as a complementary, experimental approach to the digitized archive, in which textual associations are constituted propositionally, iteratively, and (sometimes) temporarily, as the result of probabilistic computational models” (521–522). We see “speculative reading” as building on these frameworks, as well as from debates over close, middle, and distant reading in digital humanities. But our emphasis on the speculative goes even further.
We demonstrate how speculative reading as a framework can help us consider not only the scale of what is missing but also illuminate individual records. Barring the discovery of a previously unknown cache of archival materials, computational and statistical methods present an exciting but under-utilized avenue for investigating, estimating, and extrapolating on the missing information in this archive.[2] We present a case study that focuses on Hemingway, who first joined the lending library in 1921 but, as we have noted, has incomplete borrowing records even though he is one of the more famous members of the library. While scholars have attempted to identify his reading habits from his letters and other archival sources, we demonstrate how predictive methods, which are generally intended to forecast future interactions, can be repurposed to predict the past. Rather than producing definitive answers, these methods are best understood as a form of speculative reading, where models provide a means to experiment in knowledge creation. Similar to the Uncertain Archives research project, we aim to “carve out an epistemic space for modes of inquiry that are motivated less by providing answers than by posing questions, exploring uncertainties, and offering material and speculative approaches” (Agostinho et al. 423).
Speculative Estimates and Forecasts: Calculating the Shape of the Shakespeare and Company Lending Library
We want to reiterate that missing data is not unique to the Project or any data derived from cultural materials. In recent years, digital humanities scholars have proposed a variety of approaches to understand missing data, drawing from several disciplines and methodologies.[3] Drawing on this scholarship, we begin by estimating the extent of missing data for the lending library during the years Shakespeare and Company was open to the public, 1919 to 1941.[4] The Project data sets comprise information from three sets of physical sources: logbooks, lending library cards, and address books.[5] However, none of this data is complete. To fill in these gaps, we use forecasting, modeling, and statistical techniques to estimate what percent of each of these resources have survived. While our estimates are far from perfect, they help us understand the scale of the library and offer a way to begin to grapple with missingness in archives.
Missing Membership Activity
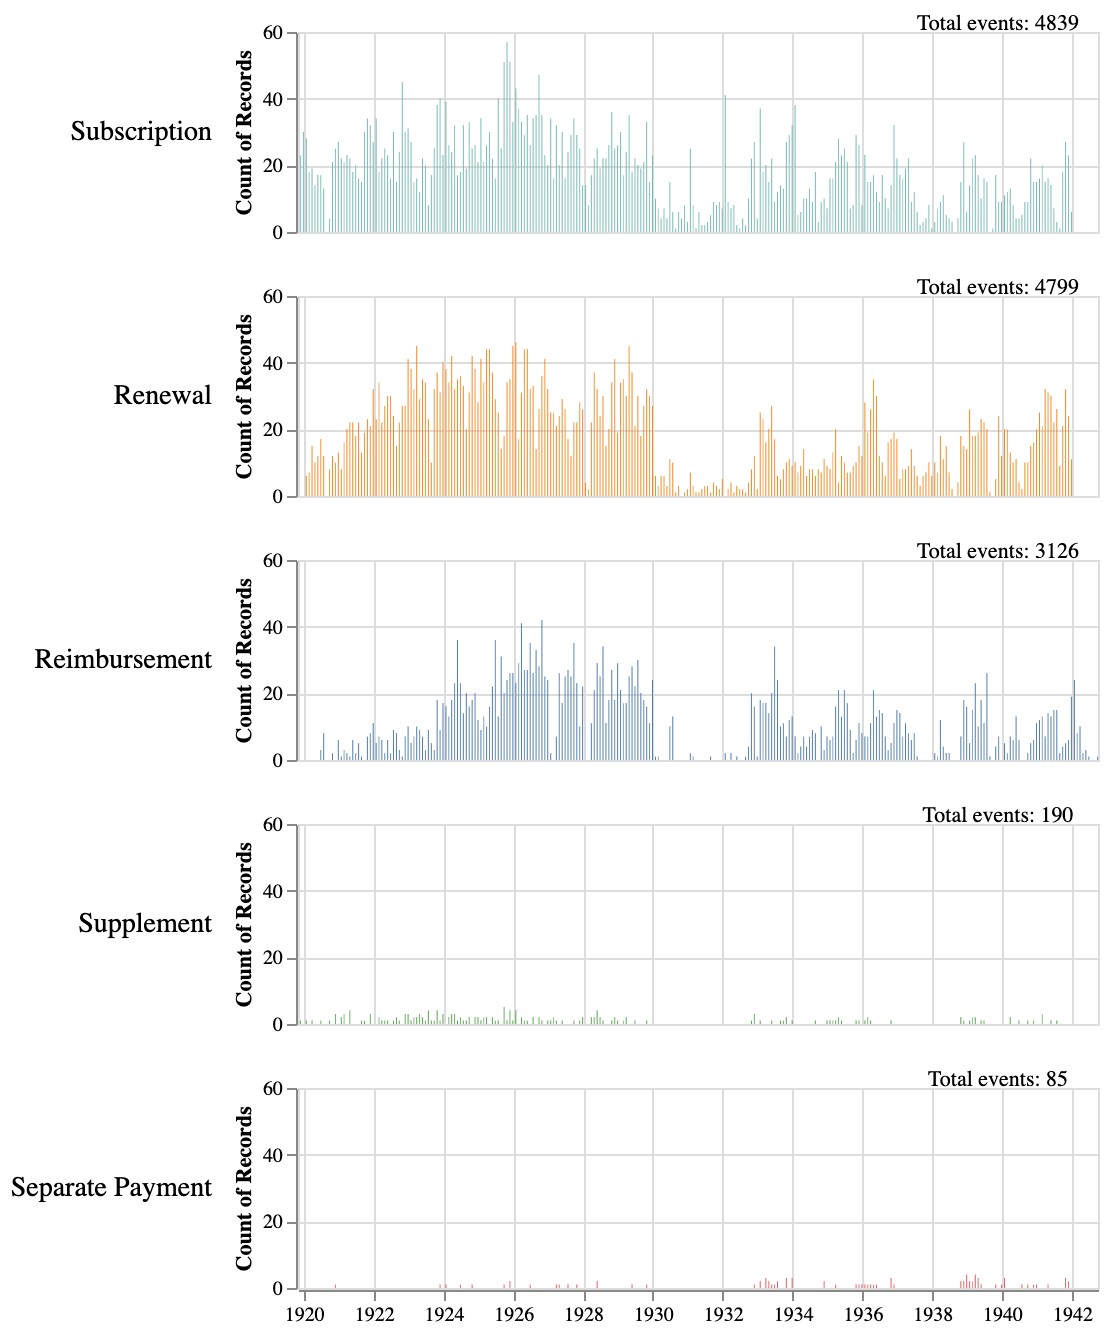
Although Shakespeare and Company is best known as a hub for expatriate literary communities in Paris and the publication of James Joyce’s Ulysses, the Project provides a great deal of data about the day-to-day operations of the lending library, specifically from the logbooks, which provide daily records about when members joined, renewed, purchased supplements, made separate payments, and received reimbursements.[6]

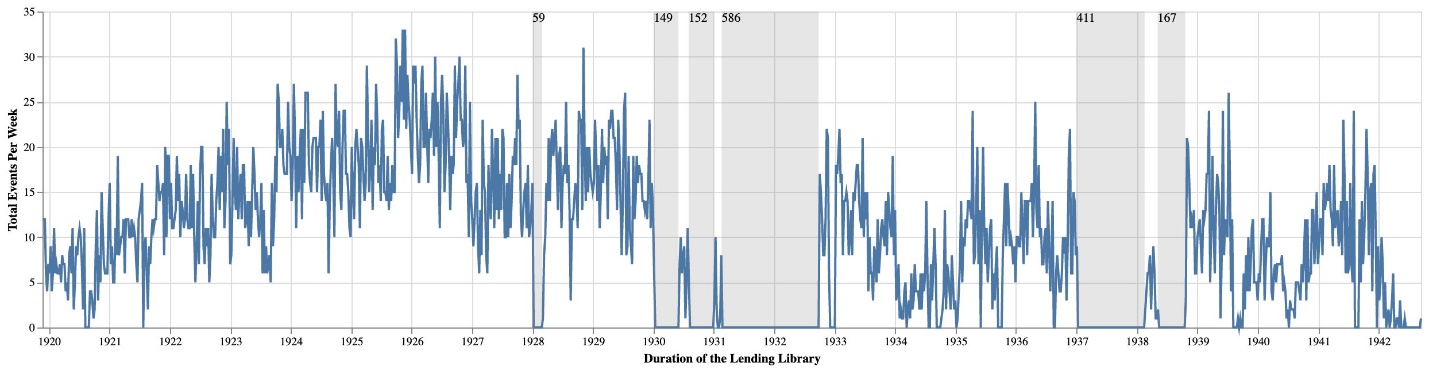
Figure 1 details the breakdown of these membership activities across categories and visualizes the unevenness of these activities over the lifespan of the lending library. Overall, the data in the logbooks is remarkably consistent; however, not all the logbooks have survived. Project researchers have compiled a list of all logbooks, which we used to uncover gaps in these records. Based on these dates, we have identified seven large gaps ranging from two months to over a year and a half (fig. 2).[7] While these gaps do not prevent researchers from using the Project’s data, they represent a challenge for any downstream computational analyses that assume consistent patterns.

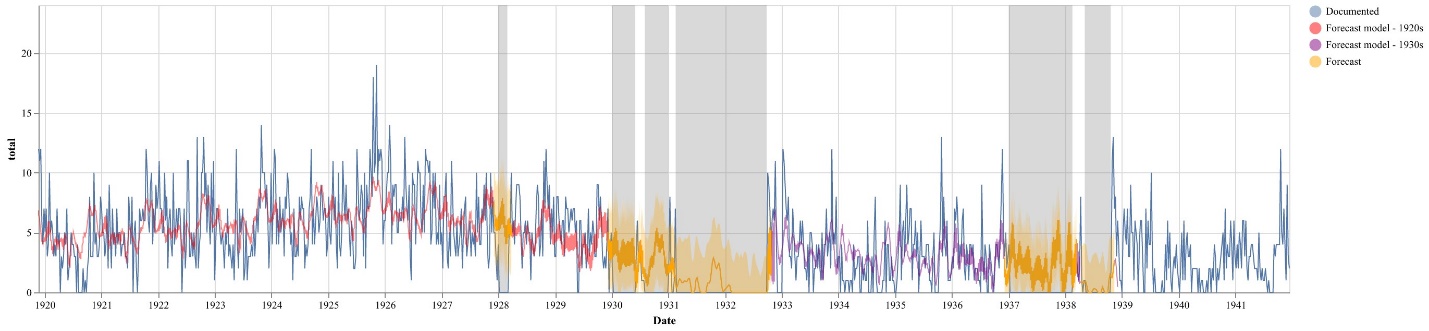
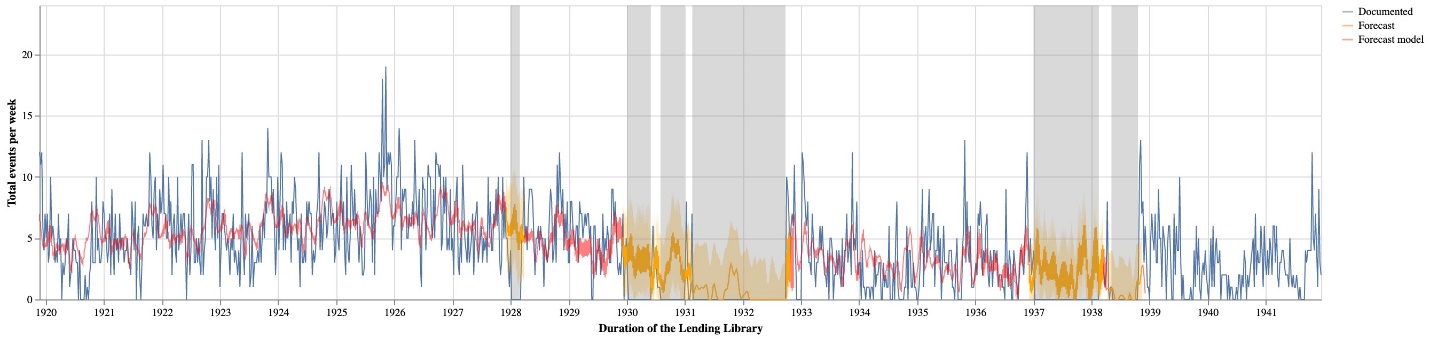
To start “reading” this missing data, we turned to forecasting models, and specifically created a time series model to predict missing events not covered by the logbooks. To generate these predictions, we aggregated extant membership activity by week based on the date of each event (subscription purchase date for subscriptions, renewals and supplements; start date for everything else).[8] Forecasting is a popular methodology in data science, often used to identify trends that can impact business decisions (Taylor and Letham 1, 2). We believe this approach is well-suited to modeling logbooks, which after all track business transactions. With these models, information from periods covered by the logbooks can be used to extrapolate the likely activity that occurred during the gaps. We implemented our forecasts with the popular Python library, Prophet, described as “a time series forecasting model designed to handle the common features of business time series” (Taylor and Letham 5). We selected this library because the parameters and outputs are specifically designed to support the fine-tuning of the models.[9] Whereas a business analyst might design and interpret a forecast based on their knowledge of market size or the impact of new products, we use our knowledge of the membership activity after the logbook gaps.

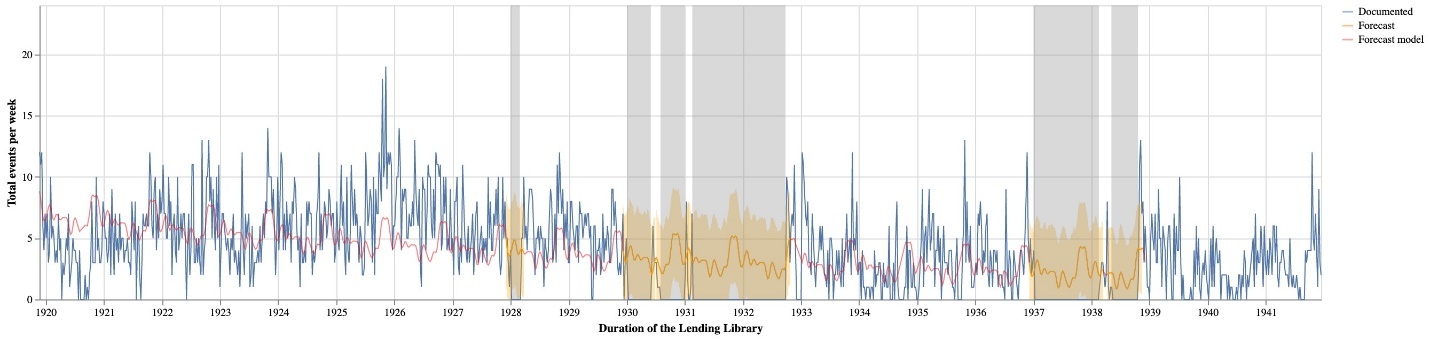
To create figure 3, we fit a Prophet model based on the number of membership events per week, and then use that model to forecast over the identified gaps. Because of the large gaps and the difference in activity between the 1920s and the 1930s, we fit two separate models for the time periods. When we aggregate the forecast values for the weeks included in these gaps, we arrive at a total of 2,335 missing events, with an upper bound of 3,601 and a lower bound of 1,095.[10] Adding our estimate to the existing 11,601 events from the logbooks results in an estimated total of 13,936 events (upper 15,203; lower 12,350) that would be documented if all the logbooks were available. Based on this estimate, eighty-three percent of membership events (upper seventy-six percent; lower ninety-four percent) are represented in the surviving logbooks. When we account for the 1,438 membership events drawn from other sources, we conclude that ninety-four percent (upper eighty-six percent; lower 106 percent) of membership events are present in the published dataset.
Since Prophet produces a fairly complex model, we can compare forecast numbers to estimates made from some basic assumptions about membership activity and back-of-the-envelope math.[11] Using the 11,601 membership events from the logbooks, we calculate an average of 1.3 events per day for dates covered by existing logbooks, including weekends and holidays. While events did not actually occur at this rate, we can apply that average to the 1,538 days in our identified gaps to arrive at an estimate of 1,999 missing events for a total of 13,600 events that would be documented in all the logbooks. Accounting for supplemental membership events from address books and lending library cards, we end up with a total of 13,042 membership events, which would lead us to conclude that ninety-five percent of all membership activity is documented in the dataset. Given that our Prophet model, which is more sensitive to the actual historical data, gives us a ninety-three percent estimate, we are relatively confident that the current database is only missing between five–seven percent of membership activity.
Missing Members
Since the percentage of missing membership activity is relatively small, one might assume that all members in the library are listed.[12] Yet because membership data is missing for much of 1931 and 1932, and all of 1937, it is likely that there are some lending library members who are not represented in the dataset. That is, members who were only active within those time periods, whose lending library cards were not preserved, and who were not documented in either address book used to supplement the logbook gaps.
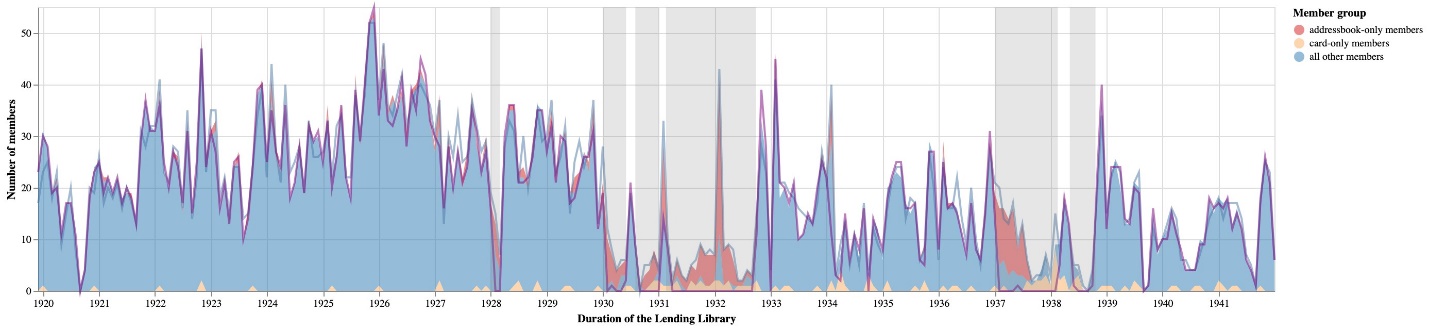
In figure 4, we graph the frequency of new members in the library. We consider a member to be “new” based on the date of the earliest event associated with an account. The majority of new member events come from the logbooks, but by aggregating and identifying members who only appeared in the address books (329 members) or lending library cards (124 members), we can see both the full rise and fall of the library’s membership over time, as well as those time periods where the address books supplement significant portions of membership data for missing logbooks.

When new members joined the lending library, the first step was to pay for a subscription, usually with a deposit that was kept as security and reimbursed when the account was closed (Kotin and Koeser, “Data Sets” 4). And indeed, when we look at the first events for members, the overwhelming majority start with subscriptions. Because the extant logbook data is so consistent, and because the logbooks are the primary source of subscription information, we can use a similar forecasting approach to estimate the number of new member subscriptions lost due to the missing logbooks. We start by identifying all members who had a subscription or renewal recorded in the logbooks as their first event (4,320 members).[13] We then aggregate the number of new member subscriptions to create a time series similar to the one discussed in the previous section and then fit a model to forecast estimates for new subscriptions during the gaps.

Figures 5 and 6 represent two different Prophet models for forecasting the same missing new subscriptions, based on linear and logistic growth models respectively. The default linear model predicted fewer missing subscriptions (458) than the total number of members supplemented from non-logbook sources (819); meaning that the datasets have more members than would have been included if all logbooks were available. Yet a visual inspection of the graph for this forecast model indicates that it is picking up a downward trend from the data before our larger gaps, which results in a forecast that does not match the data after the gap. To further validate and finetune this model, we reran the forecast using a logistic growth model, and set a cap of nineteen based on the maximum number of new subscriptions from all weeks in our data (the peak is the week of November 8, 1925). When the estimates from the growth forecasts are aggregated, we arrive at an estimate of 1,027 missing new member subscriptions (upper 1,725; lower 368). When tallied with the existing 4,320 records from the logbooks we arrive at an estimated total of 5,346 new member subscriptions (upper 6,045; lower 4,688). When compared to the 5,139 total number of members across all sources, this estimate indicates that we are missing 207 members (upper 906; lower 0) and that the dataset covers ninety-six percent (upper eighty-five percent; lower 110 percent) of the full membership.
To check the results from our Prophet models, we can again estimate using some simple calculations to see how they compare. On average, there are about 0.4 unique members per membership event in the logbooks; that is, roughly every third event adds a new member. If we assume that this ratio is consistent for the lifetime of the library, then based on our previous estimation for all logbook membership events we arrive at a total of 5,538 (upper 6,040; lower 4,904) members included in the logbooks if there were no gaps (399 missing members; upper 901). Based on the 5,139 accounts in the dataset, this estimate indicates the dataset includes ninety-three percent (upper eighty-five percent; lower 105 percent) of the members who would be included in the full set of logbooks. However, since this estimate is based on our previous estimate for missing membership, the uncertainty is compounded.
There’s additional complexity to estimating missing members, since the total number of accounts in the dataset is slightly inflated; there are members with the same name who are represented as separate accounts, due to Project merge guidelines.[14] For example, there are nine different accounts for members named Kohlberg with dates ranging from 1933 to 1942; at least some of these accounts are likely the same person, but perhaps not all, and certainly not all for other members with more common names. As a counter to the inflated member estimates, to provide a minimum estimate for members we ran the same calculations but aggregated events by unique member names instead of unique member ids (effectively merging all unmerged accounts for people with the same name, which results in a total of 4,720 accounts). Rerunning Prophet on new subscriptions for these accounts results in an estimate of 897 missing new subscriptions (upper 1,463; lower 283). When tallied with the existing 3,975 records from the logbooks, this gives an estimated total of 4,872 new subscriptions (upper 5,539, lower 4,258), and 152 members missing from the complete dataset (upper 818), resulting in ninety-seven percent (upper eighty-five percent, lower 111 percent) coverage of the full membership. When we recalculate the simpler estimate using the same aggregation, the rate of unique members per membership event goes from 0.4 to 0.36 and produces a tally of 332 missing members, but the actual percentages are unchanged: ninety-three percent (upper eighty-six percent, lower 105 percent) coverage. This result aligns with our intuition that over the lifetime of the library there would be fewer new members over time, as previous or existing members returned or renewed their subscriptions. This matches the forecasted trend for estimated percentage of members missing going down over time, indicating that we are missing fewer member accounts than one might expect.
Our estimates offer some bounds for the total membership: 5,350 based on Project identifiers (which is a slight overestimate) or 4,872 based on unique names (which is an underestimate). However, in either case the data includes over ninety percent, or almost all the members.
Missing Borrowing Activity
We hope that the prior estimates will be of use to scholars studying lending library members, but we expect that many scholars will be most interested in the borrowing activities of members. Borrowing activity—that is, the specific books and periodicals that a member borrowed—is tracked solely on lending library cards, and only a small portion of members have surviving lending cards, with a larger portion of the cards surviving from the 1930s than the 1920s (Kotin and Koeser, “Cards in Context”). Based on the extent of missing cards, we know that this is the most incomplete portion of the datasets in the Project.
To estimate missing borrowing activity, we focused on modeling the behavior of the members with borrowing records and the subscription information in the logbooks, specifically how members utilized their subscriptions.[15] Unlike modern libraries, which usually allow many books to be checked out at the same time, subscriptions to Beach’s lending library included specified limits. The basic subscription allowed members to borrow one volume at a time; members could pay more to borrow two volumes at a time; or could purchase a supplement to increase the volume limit (Kotin and Koeser, “Data Sets” 4, 30).
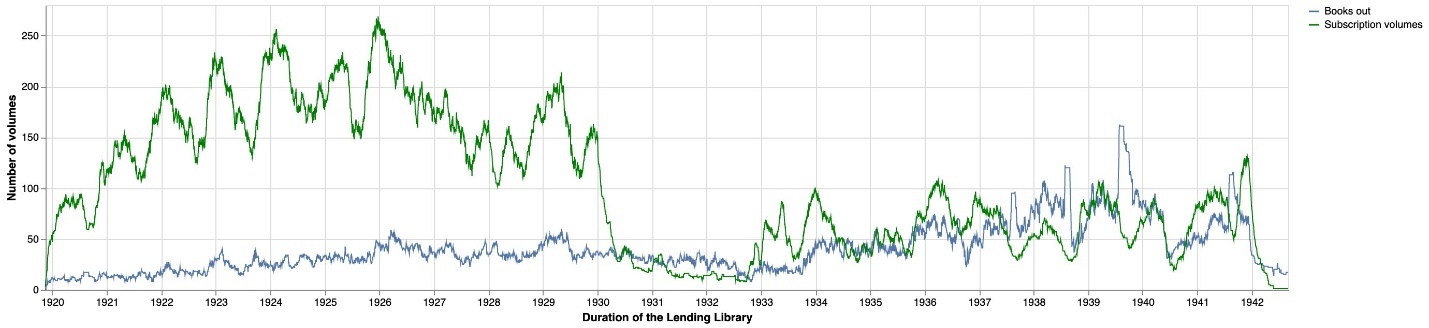
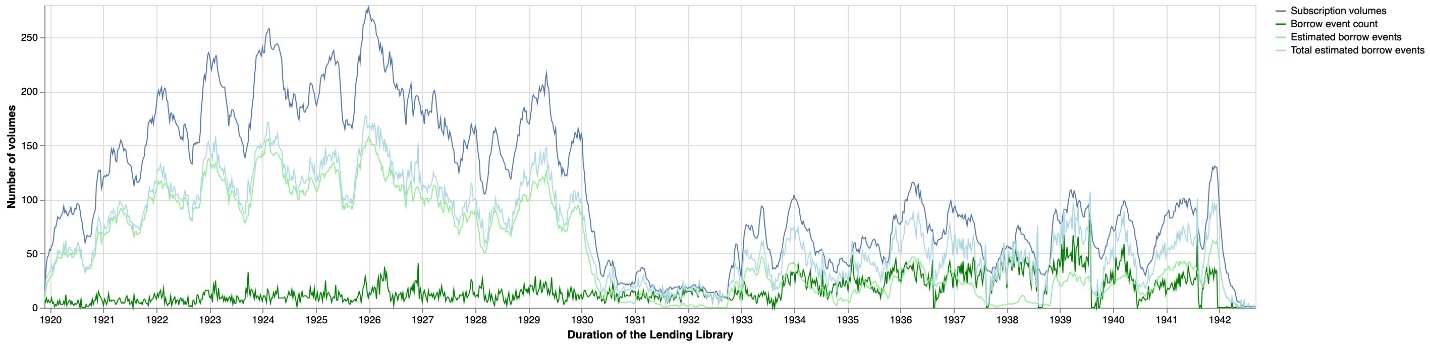
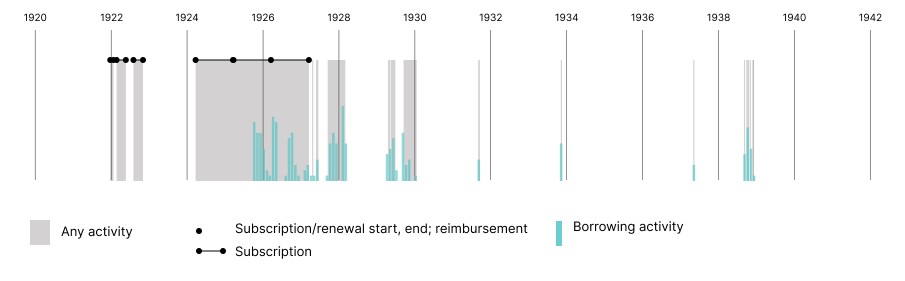
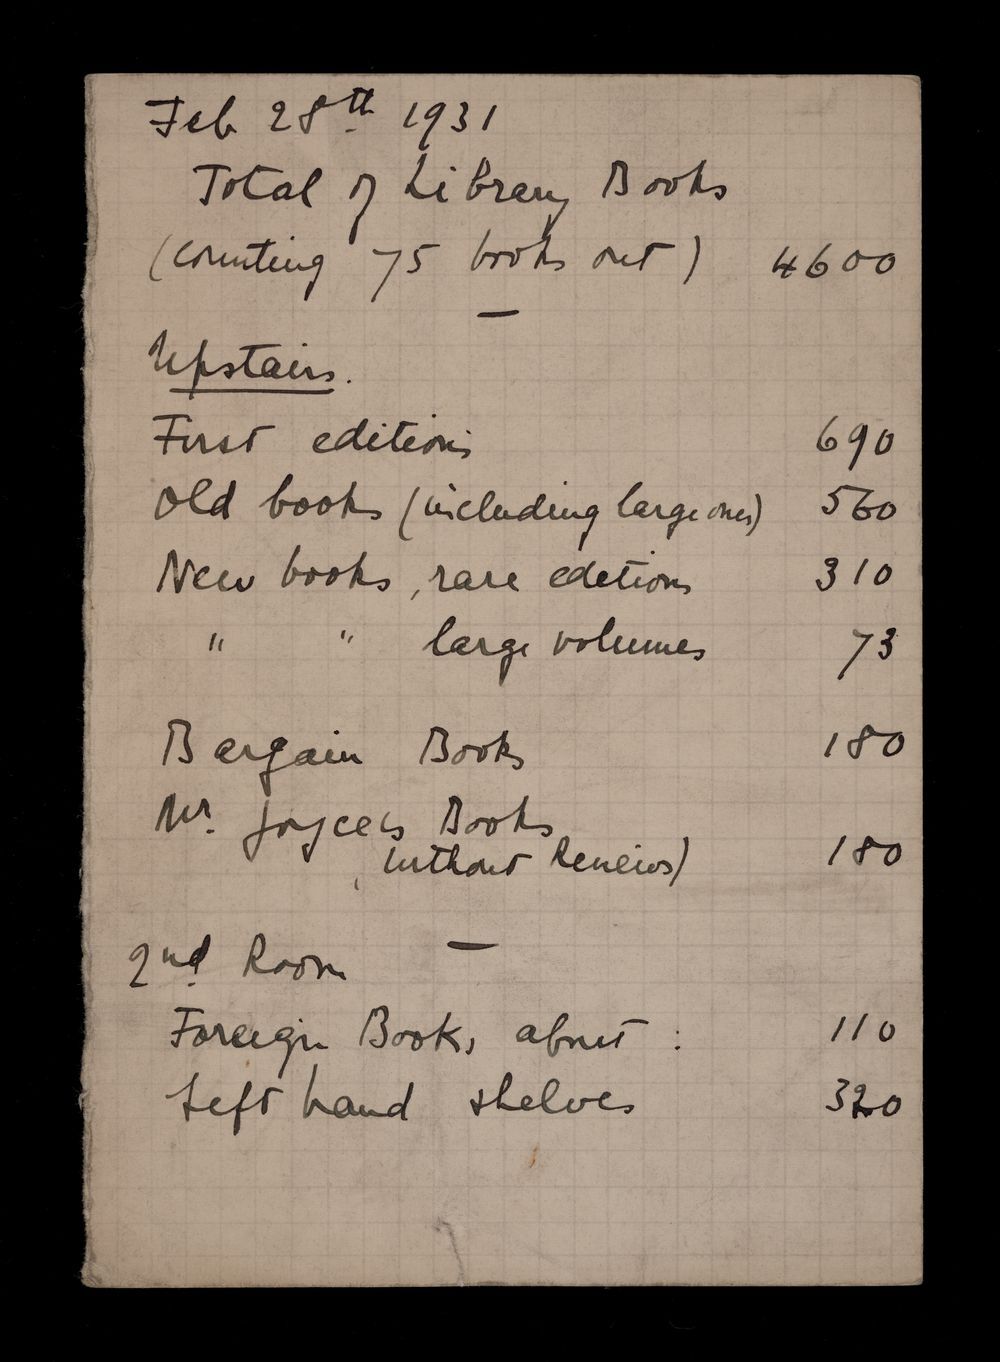
We can think of the number of subscriptions as a window into the “borrowing capacity” of the library and use that to estimate the missing borrowing activity (fig. 7). Because subscriptions were expensive, members typically took full advantage of their privileges, borrowing a book the same day they subscribed and borrowing a new book on the same day they returned an old one. In fact, our analysis indicates that members were more likely to go over their subscription volume limits than underutilize their privileges and that Beach became much more permissive in the later years of the lending library (fig. 8). We can illustrate this by comparing numbers from Project data with a handwritten tally from February 28, 1931, which notes that seventy-five books were checked out (see fig. 9). On that date, there are thirty-one active subscriptions documented and thirty-two borrowing events recorded; because a few of those subscriptions were for more than one volume at a time (three subscriptions for two volumes each and one subscription for three), we calculate that based on these subscriptions there should be a maximum of thirty-six volumes checked out.[16] The seventy-five checked out books documented on that hand-written tally are double what we would estimate based on subscriptions.

Yet even this tally, which is much higher than we would estimate based on Project data, might be less than the actual activity of the lending library, given Beach’s propensity not to document free subscriptions. For instance, Fitch relates that when the composer and critic Virgil Thomson was “too poor to buy a subscription, Sylvia waived her fee,” so that he could still use the library (151). Therefore, even if we assume that members fully utilized their subscription volume limits, we can only estimate a minimum for the missing borrowing activity. Nonetheless, we believe that this lower bound is still useful. To calculate this missing activity, we assume a volume limit of one (again, a minimum) for all subscriptions, renewals, and supplements without documented volume limits. When compared to the known borrowing activity, we calculate a ratio of 0.64 borrow events per week. During the week of December 5, 1920, for example, the active subscriptions with documented borrowing would indicate that at least nineteen volumes were checked out, and there are twelve borrowing events recorded that week. When we apply this ratio to the records of subscriptions without documented borrowing activity, we arrive at an estimate of 63,330 missing borrowing events, without accounting for undocumented subscriptions due to logbook gaps. This means that the 20,597 documented borrowing events provide at best twenty-six percent of the full activity of the lending library.
Applying this method to specific time periods with reliable logbook data demonstrates the high variation in the available data. From the beginning of the lending library through the end of 1927, before the first logbook gap, we estimate at best ten percent of borrowing activity is documented (4,459 borrows; estimated total 46,025). The later periods are substantially better documented: between 1932 and 1937, fifty percent of activity is documented (5,003 borrows; estimated total 10,111) and fifty-three percent of activity after September 1939 (3,436 borrows; estimated total 6,503).
Missing Books
While we expect many scholars will be interested in members and their activities, there is also a fourth set of information that is incomplete in the Project—records of books available in the library. The extant borrowing records include numerous book titles, which have been identified and regularized by Project team members.[17] But if we have at best twenty-six percent of the full borrowing activity, how accurately do the books in the published dataset reflect the lending library’s actual holdings? The book dataset includes 6,020 records; 5,683 of them were borrowed at least once (some purchases were tracked on lending library cards, but the books were not necessarily lending library titles). If we exclude the 475 titles that the Project team has not been able to definitively identify, we arrive at a total of 5,208 books with validated bibliographic metadata in the lending library.[18]
This number sounds plausible but based on a handwritten tally in the Beach papers, we know that there were 4,600 books in the lending library in February 1931 (Beach, “Total”). Rather than removing unlisted books, we can use the 1931 total as a starting point. If we identify all borrowing events that started on or before February 28, 1931, we find 2,874 titles. By looking at the last borrow status for each item and filtering out the 109 items that were not returned, we arrive at a total of 2,765 items, or sixty percent of the total tallied by Beach. While this percentage is lower than we might expect, it is important to keep in mind that this is based on the earlier time period, when a much smaller proportion of the borrowing history is documented, and we expect that many of the borrow events that occur after this date add to our knowledge of these 4,600 books.
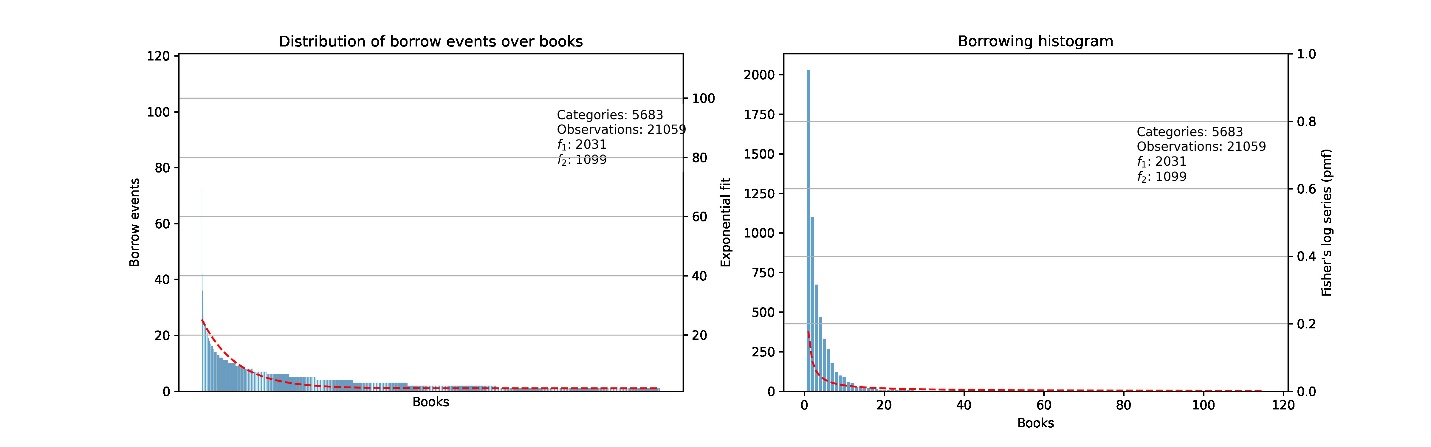
While Beach’s tally is useful, predicting missing books is also a research problem that transcends the lending library. We can also treat missing books as analogous to an unseen species, which is a common challenge for ecologists, who have developed statistical methods to correct for bias due to samples that exclude species that are difficult to observe or extinct. This approach has been applied to estimate missing portions of medieval music scores, digitized books, Shakespeare’s vocabulary, and most recently manuscripts from medieval European literature, where Kestemont et al. argue that “parallels between cultural and ecological diversity” mean these models can and should be applied to cultural artifacts (765; Cuthbert; Riddell and Bassett; Efron and Thisted).
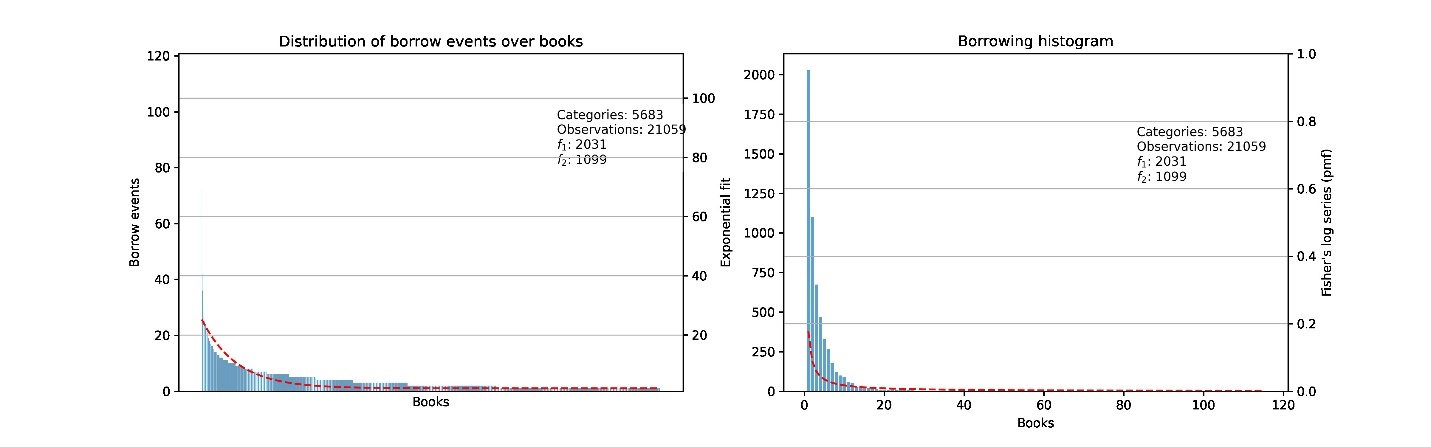
To create an ecological statistical model of the lending library, we treat each book title as a unique “species” and the “sightings” of each title is the total number of times it was borrowed (fig. 10). This approach results in estimates of total books that vary from 6,768 to 8,102, depending on the method used.[19] Based on these numbers, the Project is missing somewhere between 1,560 and 2,894 titles; this means the 5,208 certain titles provide somewhere between sixty-four percent and seventy-six percent of the total books held by the lending library.
It might seem surprising that such a small portion of the borrowing activity (at best twenty-six percent) would provide evidence for the majority of the books that circulated in the lending library (an estimated sixty-four percent to seventy-six percent). Yet since book popularity distribution follows a power law, much of the missing borrowing activity would most likely provide additional evidence for the more popular titles, rather than borrowing records of these missing books.
Although we find these estimates useful, we recognize that this approach is not a perfect fit for lending library books. Our estimates treat individual books as “species,” but it’s likely that many books were only borrowed once, which differs from some of the assumptions in the unseen species model.[20] We also know the collection changed over time as Beach acquired new books, and as older books were purchased, went missing, or became damaged, and this rate of change is surely different than that of species in an ecosystem. The behavior of lending library members borrowing books is likely more complicated than these models account for, since we know that the actions of one member could easily impact others: whether waiting for a book to be returned or recommending books to another reader with similar taste.[21]
There’s one additional resource that might inform our estimate of missing books, which is a catalog of lending library book acquisitions from March 1933 to May 1940 (New Library Books Beach Papers).[22] Of the 1,055 books included in this catalog, only 106 of them (ten percent) are not included in the published datasets, which suggests that our estimates of missing books might be slightly inflated. However, relying on this acquisition catalog data to estimate the full library holdings is difficult, since we ultimately don’t know what proportion of the total these items represent. If we examine the borrowing activity during the dates covered by the catalog, the books in this catalog account for only forty-one percent of borrowing events and twenty-eight percent of the identified items in circulation; so unfortunately, the ten percent of unknown titles within the catalog can’t be applied to the lending library collection at large.
Speculative Reading
We know that Beach liked to let members browse and discover books on their own: “there was no catalog—I preferred to let people find out for themselves how much is lacking” (Shakespeare and Company 21). In many ways, the question of how much is lacking is what we have explored in this article, and we have argued that a great deal remains preserved, including the names of many of the members who would have perused the shelves and the titles of the books they borrowed. Ultimately, what remains most “lacking,” or difficult to assess, is the interactions between these members and books. Uncovering definitive evidence of individual borrowing remains impossible without archival discoveries, but surely Beach recommended books based on a member’s borrowing habits or similarity to other members, or her own taste? Such recommendations, though dependent on many variables, are not a foreign concept, given that many of us rely on recommendation systems used by online bookstores today. Indeed, recent scholarship and investigative journalism has shown how much of our contemporary cultural taste is being determined by these types of systems, whether on Netflix or Spotify or other platforms (Madrigal; Seaver). While we acknowledge that the political economy and politics of recommendation systems can and are having enormous impact on everything from data privacy and ownership to ethical cultural production and dissemination, we believe that these methods can be generative for studying the past.
Recommendation systems are typically based on two approaches, which may be used in combination: content filtering, which uses information about users or items in a system (for example, genre or publication year of a book, or the age or address for a member) to recommend similar items, or items chosen by similar users; and collaborative filtering, which uses information about known interactions “to deduce unknown relationships between users and items” (Hu et al. 263). For our recommendations, we focus on collaborative filtering since we have both readers and books (similar to users and items), and implement two established methods: memory-based and implicit feedback. Memory-based approaches to collaborative filtering utilize simpler distance metrics to calculate which items to recommend based on users with similar behaviors.[23] Implicit feedback is also a form of collaborative filtering but is more sensitive to the interactions between lending library members and the books, since it uses a model-based approach to create predictions. Implicit feedback is not assumed to convey “preferences and true motives” or even “a positive view of the product” (Hu et al. 264). For the implicit feedback model, we used Michael Ekstrand’s LensKit to evaluate recommendation algorithms, and then implemented a recommender using an implicit matrix factorization algorithm, which performed significantly better on this data than any other algorithm we tested.[24]
For our preliminary speculations, we focus on Ernest Hemingway. Because of Hemingway’s fame and interest to scholars, we have a detailed record of his reading, a catalog of books he owned, and his own comments about his reading and taste from his letters. This documentation offers an excellent opportunity to test our speculative methods, by comparing the recommendations we generated to the list of works Hemingway is known to have read or owned. In future work, we hope to apply the same methods to less well-known members, to see what a close reading of the available data and speculations about their missing data can teach us about the larger reading and intellectual communities at the library.
Ernest Hemingway’s Missing Borrowing

Before speculating, we look to the available data to see what we can learn about Hemingway’s interactions and behavior as a member of the lending library (fig. 11). He first subscribed to the library in late December 1921 for just one month, then had two successive three-month subscriptions in February and August 1922, with gaps of a month or more in between subscriptions. After another gap of several months, he renewed again in March 1924 and held three successive year-long subscriptions. His last documented subscription ended in March 1927, but he continued to borrow books through the 1930s without an active subscription, likely a reflection of his special relationship with Beach. There are 117 borrowing events on his extant lending library cards (132 book events total, with 112 unique titles) but the earliest one is only from October 1925; none of the activity from 1922 and early 1925 survives.

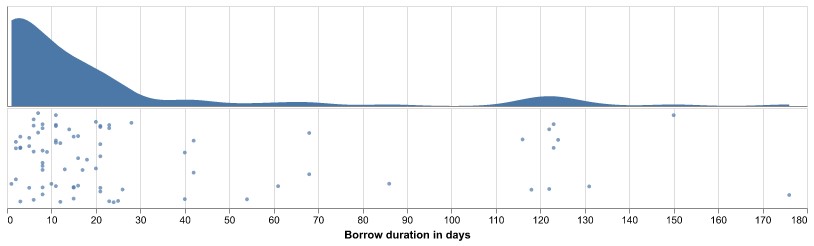
On average, Hemingway kept books out for thirty-two days (fig. 12). Sometimes he returned books after only a few days; he returned Wyndham Lewis’s Time and Western Man (1927) after only a single day in October 1927, and David Garnett’s Go She Must! (1927) was borrowed and returned on the same day.[25] But there are some books he kept out over a hundred days; a number of books checked out in May 1926 were not returned for months that year, including Ivan Turgenev’s Knock Knock Knock and Other Stories (1921), out 176 days, returned in November; W. H. Hudson’s Far Away and Long Ago (1918), out 150 days, returned in October; and Nietzsche’s Thus Spake Zarathustra (1883), out 131 days, returned in September.
The subscriptions with missing borrowing activity span a total of nineteen months, and in all but one three-month subscription Hemingway subscribed for two volumes at a time. Based on Hemingway’s typical borrowing behavior, and assuming full utilization of two volumes at a time when he had them, he would have borrowed around thirty-three books during these nineteen months; if we use the library-wide average of eighteen days, he could have borrowed as many as fifty-nine titles.
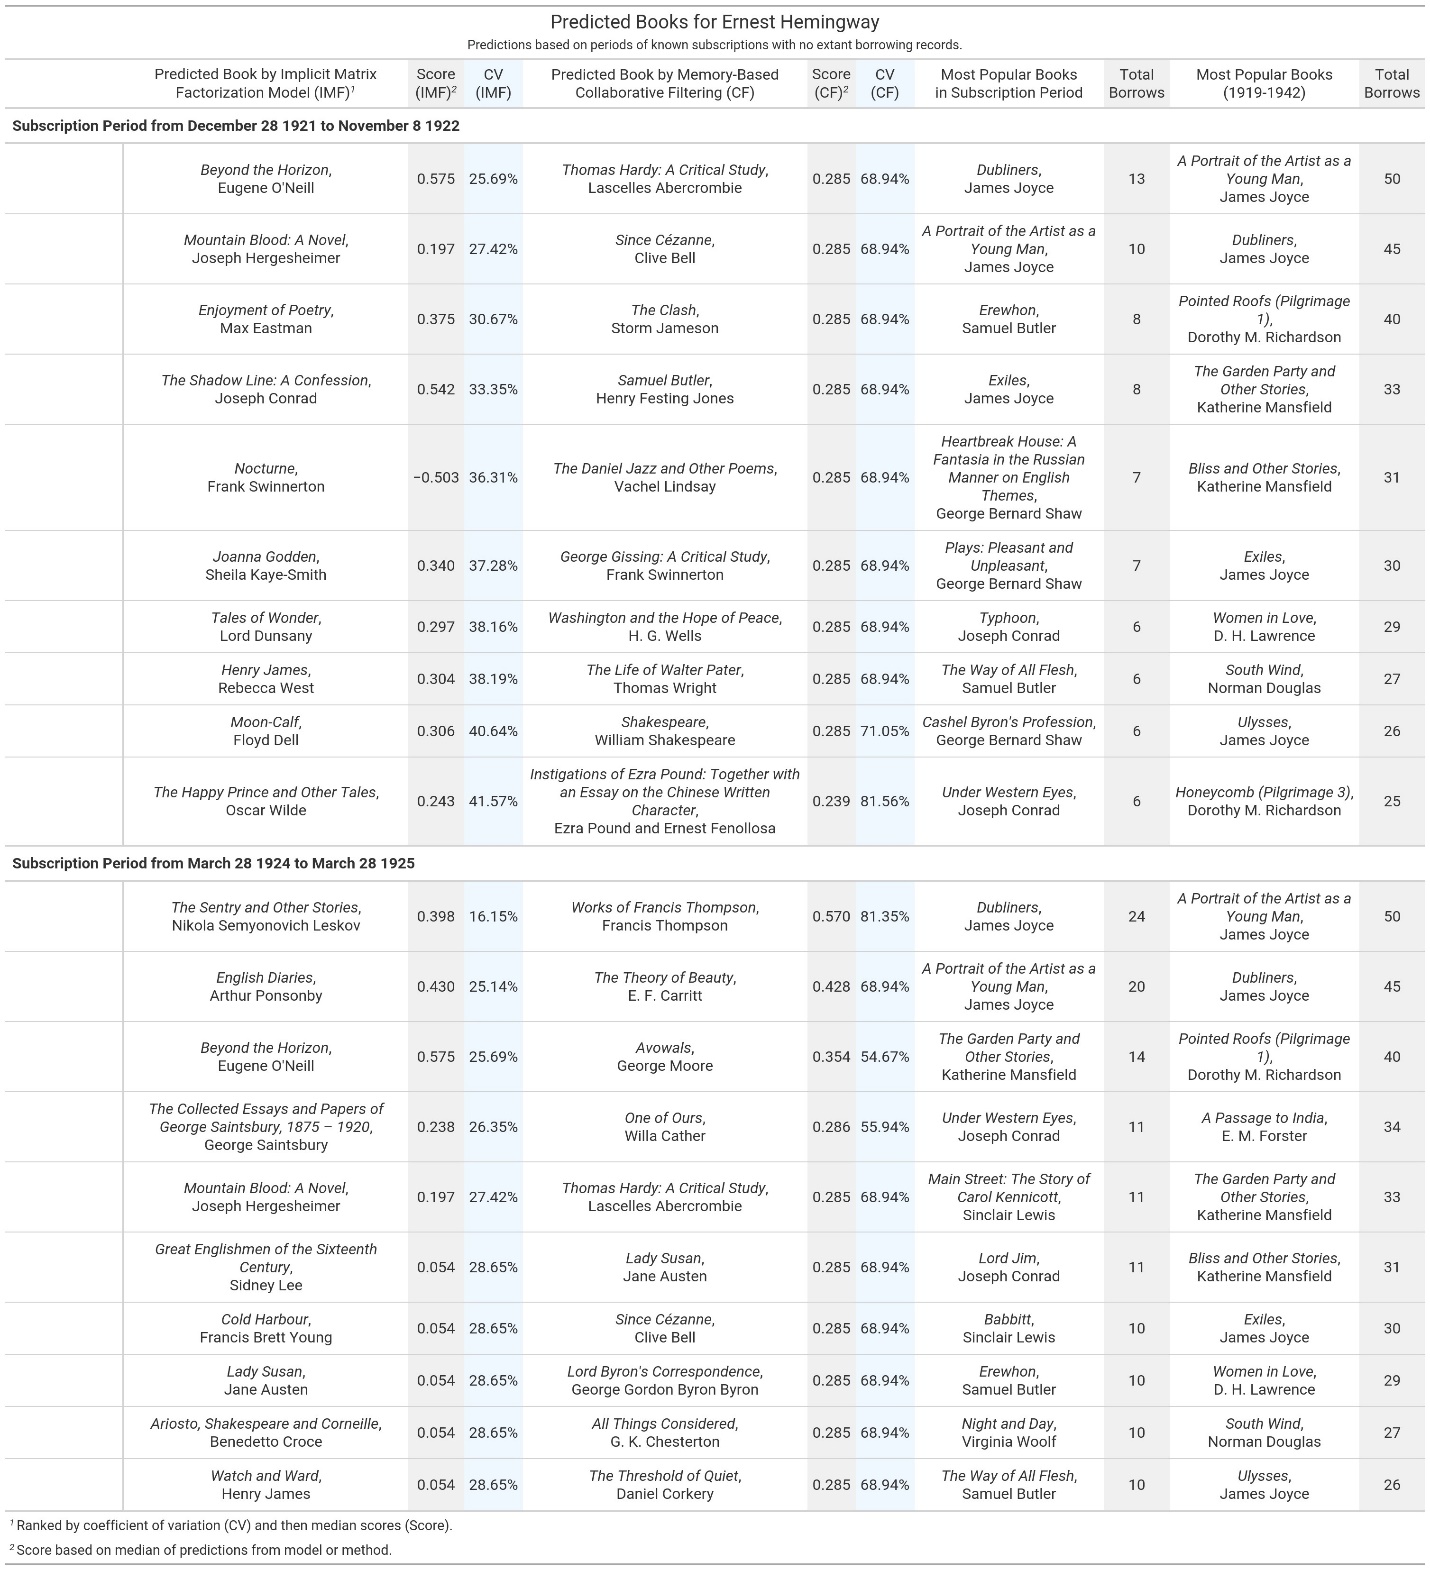
To generate these missing books for Hemingway, we utilized the periods when he subscribed to the library but for which we have no documented borrowing activity, and then created a list of recommendation candidates based on books published before or during the subscription period and held by Shakespeare and Company. We then ranked these titles for each subscription period, and in figure 13 show the top ten recommendations generated by our two different approaches, alongside the overall most popular titles in the lending library (both for all time and within that specific circulation window).[26]
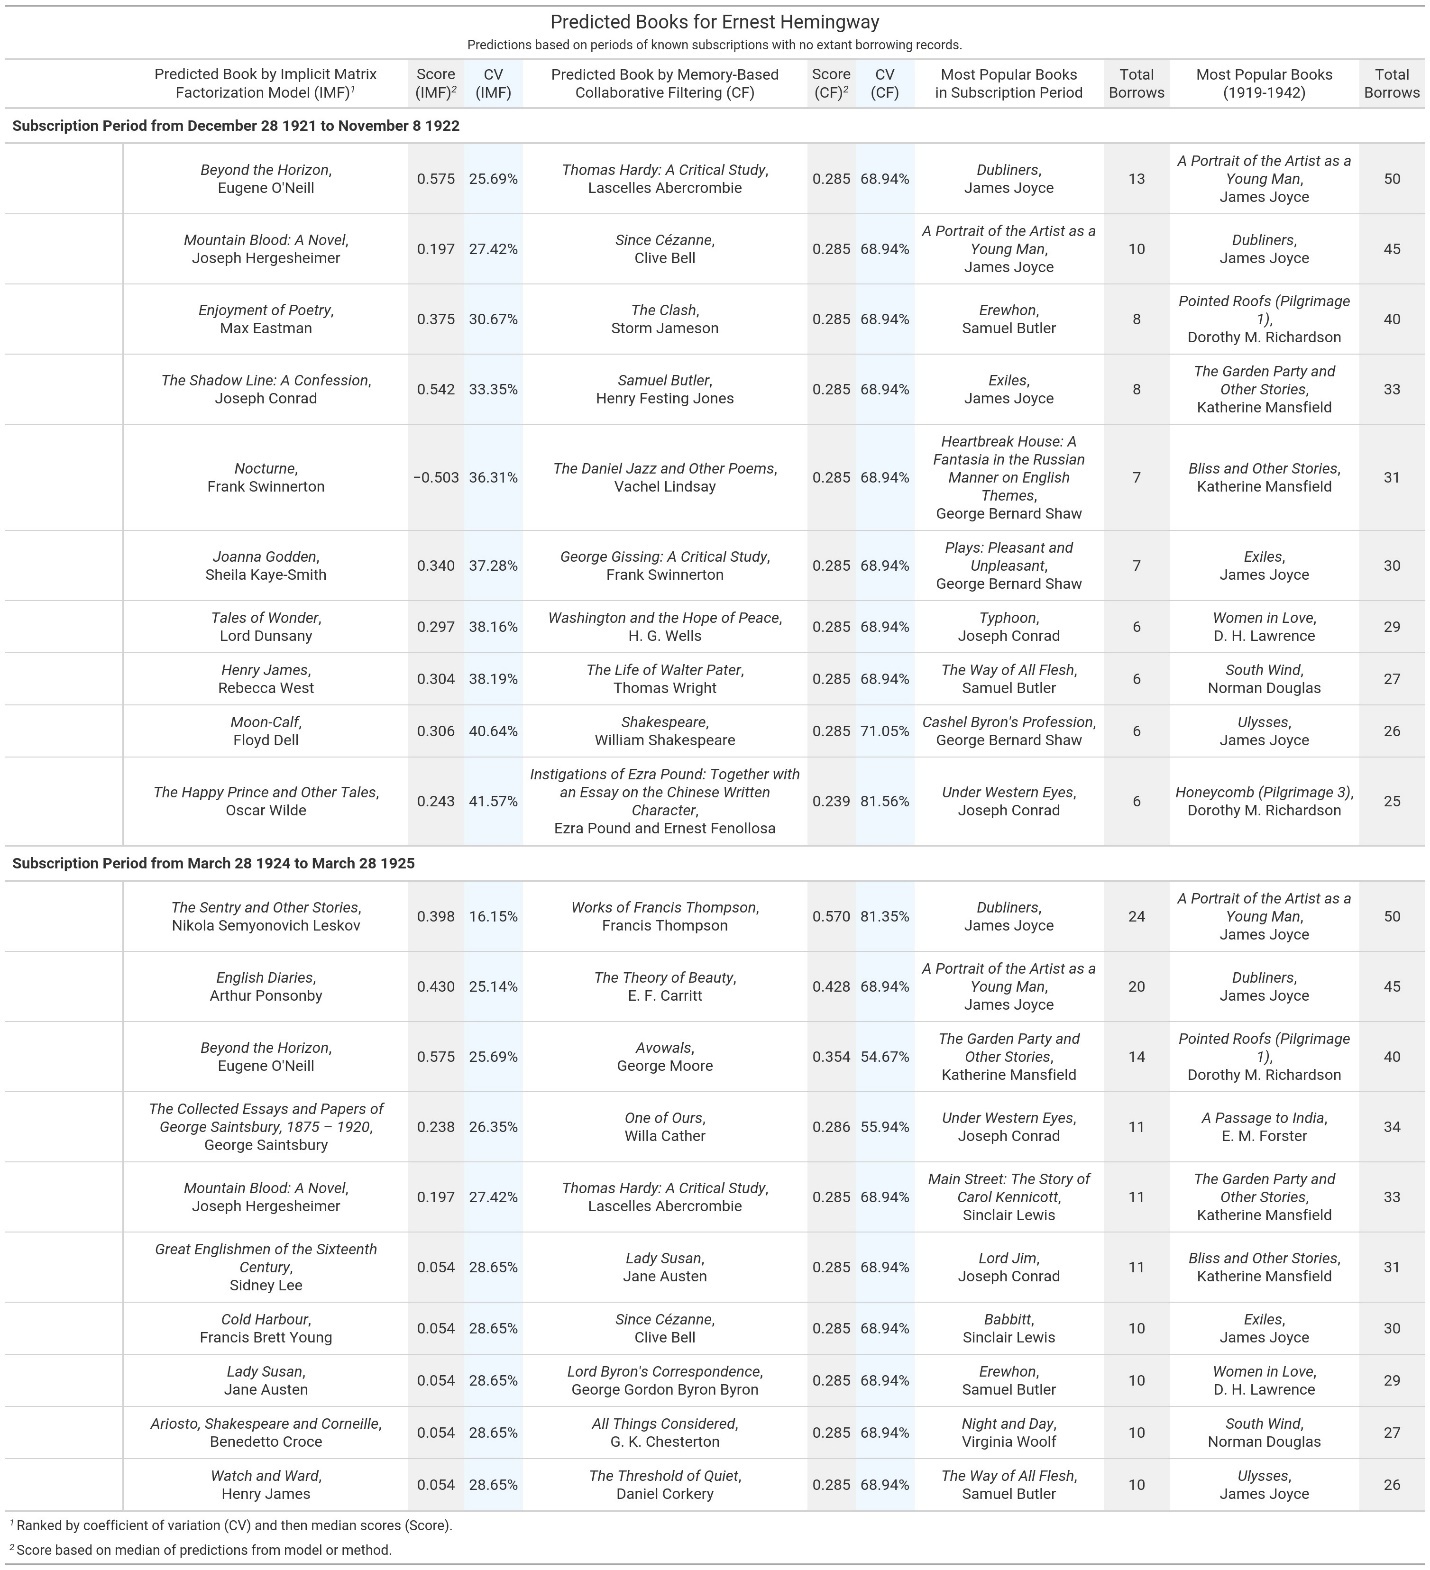

In figure 13, the top predictions on the left are the results of the implicit feedback approach, sorted by the coefficient of variation and then median score for the model. Next are the top recommendations for the memory-based approach, sorted by median score and then coefficient of variation. We include in our summary the most popular books during the period of Hemingway’s undocumented borrowing, as well as most popular over the entire lifetime of the lending library, to demonstrate that our predictions are surfacing something other than simply popularity. We are intentionally only reporting scores for books and not periodicals, which, though very popular in the library, do not have data about individual issues. Figure 14 helps further elucidate these book predictions by visualizing the individual scores for each title and providing a longer list of recommended titles using the more conservative estimate that Hemingway likely read thirty-three books. On the right are the scores for the implicit feedback approach, with the scores increasing in confidence from left to right. Each of the ticks in the plot represents one iteration of the model, which we ran one hundred times to provide the most consistent sample for scores. Notably, the dispersion of ticks is not consistent across subscription periods, and there are also some books that appear in both periods but with differing scores from the model. We specifically report the coefficient of variation in our table to account for this dispersion, since we want to recommend books that the model is more consistently confident about rather than those that might have sporadically high scores. On the left, we show the scores for the memory-based approach, which was based on three methods: cosine similarity, Euclidean distance, and Pearson correlation coefficients. All three methods use the same principle of comparing borrowers’ preferred books to find the most similar books to recommend. While many of the scores are consistent, there are some outliers where one or two of the methods are much more confident in their predictions; for example, Charles Dickens’s David Copperfield (1850) is the top recommended book for the Pearson correlation but is ranked much lower by cosine similarity and Euclidean distance.
Some of our recommendations can be confirmed by Hemingway’s letters and library catalogs. Hemingway certainly read Willa Cather’s One of Ours (1922), although he didn’t think particularly highly of it: in a June 1923 letter to Gertrude Stein, he writes that it “starts getting really good about page 425” (the first edition was 459 pages), and in a November 1923 letter to Edmund Wilson, he disparages the battle scenes as drawn from Birth of a Nation. (“I identified episode after episode, Catherized,” he writes [Letters 2: 29, 80].) His library in Cuba included Norman Douglas’s South Wind (1917), along with three other Douglas titles, and David Garnett’s Lady into Fox (1922) and a Man in the Zoo (1924) (Brasch and Sigman 129, 156). Hemingway’s library included twelve books by Garnett, some of them duplicate copies, and he borrowed two Garnett titles from Shakespeare and Company in late 1926 and early 1927. Recent scholarship suggests that not only was Hemingway a fan of his books, but that perhaps “Garnett has been overlooked as one of Hemingway’s influences” (Kale).
Many of the other recommended titles are by authors whose books Hemingway read or owned. He owned five books by Joseph Conrad and borrowed one from Shakespeare and Company in 1926. In a 1922 letter, Hemingway writes, “I read the Roosians and Joe Conrad pretty near always in the country—because they’re so long” (Letters 1: 375). He owned two books by Joseph Hergesheimer, who he refers to as “Hergo” in a 1925 letter and alludes to in The Sun Also Rises (1926) (Letters 2: 422–423). He owned two books by Samuel Butler, and mentions Hudibras (1663) in a 1926 letter (Letters 3: 41). He borrowed one title by Eugene O’Neill, owned Frank Swinnerton’s autobiography, read Lord Dunsany’s Fifty One Tales (1915), owned two titles by G. K. Chesterton, and read Chesterton’s The New Jerusalem (1920) in 1925. He was certainly familiar with Vachel Lindsay’s work—in January 1924 he cabled Ezra Pound to say he was rushing “two hundred pound California bathing beauty” to Pound’s bedside, probably referring to Vachel Lindsay’s recently published Collected Poems (1923), which was 390 pages long, and elsewhere refers to Lindsay as “the golden whale” (Letters 2: 96, 97–99).
These recommendations also surface authors that Hemingway was known to have had strong feelings about. He owned six titles by Max Eastman, but described The Literary Mind (1931) as “pretentious rubbish” (Reynolds 120; Letters 4: 615).[27] He owned eleven titles by Henry James, two of them in duplicate, but Reynolds includes Hemingway’s comment about The Awkward Age (1899)—“an enormous fake” (Hemingway’s Reading, 141; Brasch and Sigman, Hemingway’s Library, 202).
Despite Hemingway’s known interest in Russian literature, which is clearly reflected in his available borrowing record (twelve borrows of Turgenev, some of them repeats; three of Dostoyevsky, and a collection of Russian literature from Mirsky), our recommendations only include one title by a Russian writer, Nikolai Leskov. Perhaps this is because there are so few borrowing events recorded for Turgenev: the most activity recorded for any of the ten Turgenev titles is three events, and for four of these titles Hemingway is the only known borrower.
While we have delved into some of the specific recommendations, in figure 13 we also included the most popular titles for Hemingway’s subscription periods and the library overall, since popularity is a naive but often effective metric for recommendations. Many of the listed titles are in fact plausible—if unsurprising—recommendations for Hemingway. For instance, we see that titles by James Joyce feature heavily. Hemingway’s extant borrowing records don’t include any books by Joyce, but Reynolds’s list includes six Joyce titles, three of which were purchased from Shakespeare and Company in March 1934: Two Tales of Shem and Shaun (1932), Chamber Music (1907), and A Portrait of the Artist as a Young Man (1916).[28] Reynolds notes that Dubliners (1914) was “probably read by 1924” and Portrait was “probably read in the 1920s” (Hemingway’s Reading, 143). Dorothy Richardson’s Pointed Roofs (1915) and Honeycomb (1917) were both popular in the lending library, and while Hemingway’s borrowing records don’t include any Richardson titles, he owned Dawn’s Left Hand (1931), the tenth and final novel in the Pilgrimage series, and Reynolds indicates he read it in 1934. He was certainly familiar with Richardson’s work, since in 1924 he wrote a letter to her requesting a short story, which was published later that year in the Transatlantic Review (Hemingway to Richardson, Letters 2: 126).
Though popularity provides some likely insights into Hemingway’s reading habits, this approach would overlook titles like Hergesheimer’s Mountain Blood (1915), which was only checked out twice in the entirety of the library’s history but was highly recommended in our models. Not only does our speculative approach move beyond simple popularity; many of the recommended titles and authors that are confirmed or partially confirmed by Hemingway’s letters and libraries are not authors included in his documented borrowing history—indicating that these recommendations are based on commonalities between his borrowing activity and other members of the library. This finding requires further analysis beyond the scope of this paper, but we believe even this initial exploration presents the value of speculative reading, which not only helps confirm the work of previous scholars, but also opens new research avenues for conceptualizing and studying reading communities and individual members of the library.
Conclusions and Future Work
From starting with a vague notion that some imprecise amount of data was missing from the Project, we have demonstrated that this missingness is something that we can consider as an object of study outright, rather than something that is incalculable, and thus unknowable. As our estimates have shown, the Project datasets are rather astonishingly complete in many aspects despite being based on partial archival records: ninety-three percent of membership activity, ninety-six percent of members, and sixty-four percent to seventy-six percent of the books despite only including at best twenty-six percent of the borrowing activity. We acknowledge that these numbers are indeed estimates. They are not perfect or conclusive, and future research will hopefully improve on our methods here. But we do believe that producing these estimates is crucial for helping other researchers understand the shape of this data and for giving us substantial grounds for speculation and interpretation within the remaining missing data. In essence, we have moved missing data, usually detailed in a footnote for most papers, from the margins of our analyses to the center.
To understand this missing data, we have also introduced ways in which we might speculatively fill in those gaps using forecasting and recommendation systems. Such approaches are relatively established in industry and other disciplines but remain fairly novel for digital humanities. The one exception is recent scholarship in digital archives, focused on discovery and recommending related materials to users. Taylor Arnold, Peter Leonard, and Lauren Tilton argue that recommender systems are “organization systems” that go beyond suggestions to shaping knowledge; we propose to take such systems even further, using them not only to shape but create new knowledge (S2155). Yet there remains much to explore; there are many ways our speculative work could be refined and improved, not only our estimates and recommendations, but through the use of additional methods, including network analysis, stability measures, and feature importance, which we hope to explore in future work. We also rely on existing software packages for several of our analyses, which raises concerns over whether we are as Koeser has written elsewhere “trusting others to do the math.” We have endeavored not only to be transparent when using others’ code, but to explain how these methods work and our decision to use them. As Benjamin Schmidt has argued, it’s far more important to “understand the transformations that algorithms attempt to bring about” in our sources and interpret the results than to implement algorithms from scratch (547).
As a possible next step, we hope to further validate the results of speculative reading through generating recommendations for some of the less famous, but most active members, such as Fernand Colens, France Emma Raphaël, and Eleanor Kittredge. Through expanding our analysis, we hope to gain insights about the kind of books these individuals borrowed, and more broadly how their taste aligned with other members of the lending library. We also hope to continue the approach in this article of modeling the activity of well-known members such as Nathalie Sarraute, and then corroborating our recommendations and methods with existing scholarship, as well as collaborations with literary scholars. Further speculations might be possible building from the work of Antoniak et al. in “The Afterlives of Shakespeare and Company in Online Social Readership” in this cluster, where the authors matched Project book records to Goodreads. We could train recommendation systems on this larger body of reading activity, identifying similar reading behavior and even speculating about what contemporary books Hemingway, Joyce, and others might have read and liked—speculating further across time and reading communities.
More broadly, we believe our speculative approach has potential for application to other partial, historical datasets and archives where missing data can become a space for interpretation, and available information can provide a means to estimate, quantify, and speculate. Returning to Onuoha, we agree with her argument that “the word ‘missing’ is inherently normative. It implies both a lack and an ought: something does not exist, but it should.” And such a provocation we believe allows us to contend with missingness not simply as a technical category for measurement, but as a conceptual framework that considers the structures that create missingness and the question of whether missing data “should” exist. Such a perspective is crucial for accounting for the processes that shaped the Project; and it offers a path to understanding what missingness means—a path away from a techno-capitalism that identifies missingness as an excuse for compromise and control, and toward missingness “as an engine of creativity and innovation” (Agostinho et al. 425). And so rather than attempt to conquer or colonize these gaps in the Project, we have attempted to understand and interpret them. Ultimately, we hope to inspire other scholars to not simply accept missing data as a frustrating but familiar aspect of humanistic research that must be worked around. Instead, we hope future research will start to treat it as a generative space for exploration, speculation, and discovery.
Acknowledgments
Our thanks to Amy Winecoff for consulting on recommendation systems and pointing us to Michael Ekstrand’s Lenskit; to Verna Kale and Sandra Spanier for reviewing our results for Hemingway and suggesting resources related to the recommended authors and titles; to Maria Antoniak for feedback on an earlier draft; to Kevin McElwee for preliminary work describing, structuring, and estimating the missing data; and to Joshua Kotin for providing book catalog data, finding Beach’s handwritten tally of books, and editorial guidance and encouragement. Code and data used for this article is accessible on https://github.com/rlskoeser/shxco-missingdata-specreading.
Data repository: https://doi.org/10.7910/DVN/IFSAMY
Other approaches not used in this article that have been tested to some extent in the humanities include bootstrapping and sampling.
This is not out of the realm of possibility, given Joshua Kotin’s propensity to discover new sources to augment the Project; but finding a major source, such as a presumed non-extant logbook or substantial cache of lending library cards, seems unlikely at this point.
For examples, see Ryan and Ahnert’s “The Measure of the Archive” (2021), which utilizes network science methods to explore the stability of historical correspondence networks. In their conclusion, the authors strongly advocate for data curation to include studying “missingness, and, moreover, where possible, the effect that this might have on resulting quantitative results.” Yet as these authors note, methods from these fields have yet to be widely adopted among those working in the humanities. One exception is Lincoln and Van Ginhoven’s work on modeling missing data in provenance data from the Getty Art Institute, where they assert that “such methods should be central to data-based digital humanities practice.” More recently, Riddell and Bassett have compared 1830s bibliographies to the Google Books database to show that works by women were less likely to be digitized than content by their male counterparts. Similarly, Cuthbert debunked the common assumption in medieval musicology that surviving medieval Italian scores represented only the “tip of the iceberg” by showing that a large portion of the musical pieces referenced in lyrics survived.
We limit ourselves to these years, which cover the bulk of activity during the official years of the lending library. There was a trickle of activity after 1941, significantly different in scale, which “reflects the fact that Beach continued to loan books after Shakespeare and Company closed” (Kotin and Koeser, “Data Sets” 28).
This work is based on the 1.2 version of the Project datasets. Kotin and Koeser, “Dataset.”
For more about these categories, see Kotin and Koeser, “Data Sets” 27.
We omit four smaller gaps of two weeks or less, half of which occurred around the new year when the shop was likely closed. We also checked the large gaps against a list of Sylvia Beach’s known vacations compiled by Project researchers to confirm our assumption that these gaps are due to missing logbooks rather than Shakespeare and Company being closed.
We omit nine events that fall within our identified gaps: eight were incorrectly documented as being sourced from the logbooks; the ninth is documented in a later logbook.
Prophet is far from a perfect tool and we acknowledge that there are multiple Python libraries and statistical methods for time series modeling. However, unlike other approaches, Prophet was designed not for “one-step ahead forecasting [. . . but rather] more for medium-to longer-term forecasting” (Cotton), and especially for business tasks impacted by seasonality and holidays (which applies to both Facebook and Beach’s lending library, if at rather different scales!). This combined with the well-documented interface and usability made it seem a reasonable choice for our use. For more on some of the criticisms and limitations of Prophet, see Cotton.
For each of the forecasted values and estimates based on them, we provide the estimated value along with associated upper and lower bound values. Because forecasted values are uncertain, the model provides upper and lower bounds as a way of quantifying the uncertainty, essentially helping us consider what would be the minimum and maximum likely number of events to have occurred.
Notebooks in our code repository include cross-validation of Prophet performance training and predicting known time series data.
Technically, we can only estimate the number of missing accounts and not members. There’s a slight discrepancy between accounts and individual members, since the dataset includes forty-nine accounts by two members and six organizational accounts. For convenience and easier comprehension, we refer to accounts as members throughout this section.
“Beach or one of her assistants often indicate whether a membership was a new subscription or a renewal, although these indicators are not always reliable: renewals are occasionally marked as new subscriptions and vice versa” (Kotin and Koeser, “Data Sets” 7).
According to Project merge guidelines, “the team merged accounts only if they belonged to members with the same name, and the event in one account clearly fit an event in the other account.” When there was insufficient evidence, they “would rather leave members unmerged than merge them incorrectly” (Kotin and Koeser, “Data Sets” 18, 19).
We limit our estimates to borrowing activity during the official years of the lending library (1919–1941), which provide ninety-eight percent of all documented borrowing activity. We use only borrowing events, which make up ninety-two percent of all documented book activity, because other book events are more idiosyncratic and unsystematic.
This date falls within one of the logbook gaps we estimated, which begins February 17, 1931. It’s likely there are additional subscriptions between February 17 and 28, but it’s unlikely that they account for the number of books out.
We follow the language of the Project in using book “as a catch-all term: periodicals as well as articles, photographs, phonograph records, and prints circulated in the lending library” (Kotin and Koeser, “Data Sets” 6).
For example, there is a record for volume titled Village, which the Project team believes is likely “either Ivan Bunin’s The Village (1909, 1923) or Robert McAlmon’s Village: As It Happened through a Fifteen-Year Period (1924)” but for now the volume is classified as “unidentified.” “Village.”
Estimates were calculated using the Python library Copia, using the Chao1 estimate of bias-corrected species richness, from Kestemont et al. Because we suspected that using raw borrowing numbers might overemphasize periodicals and multi-volume books, we also calculated the estimates based on the total number of unique borrowers—in effect, treating each individual member’s lending library card as a single witness to the existence of each title mentioned; these results showed only slight variation from the estimates presented. The lowest estimate of 6,760 is from Chao1, which provides a minimum. Other estimates were 7,132 (Improved Chao1), 6,699 (ACE), 8,102 (Jackknife), and 7,629 (Egghe & Proot).
Ecological models have been applied across a number of disciplines, and the “species” being estimated can be variously defined as “biological species, individuals of a target population, patients/cases in epidemiology and medical sciences, bugs in software programs, words in a book, genes or alleles in genetic code, or other discrete entities” (Chao and Chiu).
For instance, Fitch notes that there was a waiting list of borrowers for Radclyffe Hall’s Well of Loneliness (1928), which was banned in England and New York (279). For another example, see Antoniak et al., “Afterlives” (15), in this cluster on Raphaël and Killen.
Analysis based on a spreadsheet of acquisitions compiled by Robert Chiossi for the Project.
For a further example of using collaborative filtering with cultural data, see Pruett.
Algorithms were evaluated by normalized discounted cumulative gain, which is appropriate for our intended use: we have no data on ratings of books, nor are we interested in predicting ratings, but our speculation relies on recommendations being ranked in the correct order.
The start date for this borrow event is incorrect in the version 1.2 dataset; Reynolds notes the same-day return and the digitized lending library card confirms it (Reynolds 128; “Ernest Hemingway’s Lending Library Cards”).
Hu et al. note that popularity is a useful comparison for evaluation: “this naive measure is surprisingly powerful, as crowds tend to heavily concentrate on few of the many thousands available shows” (268).
Eastman’s Enjoyment of Poetry (1913) is the only title in the top recommendations of both our methods (Brasch and Sigman 133–34).
An image of the 1934 invoice is included in Beach, Letters, appearing in an unpaginated section of plates.